. 2009 May 1;436(1-2):12-22.
doi: 10.1016/j.gene.2009.01.013. Epub 2009 Feb 5.

Repetitive DNA elements, nucleosome binding and human gene expression

Affiliations

Repetitive DNA elements, nucleosome binding and human gene expression

Ahsan Huda et al. Gene. .

Abstract

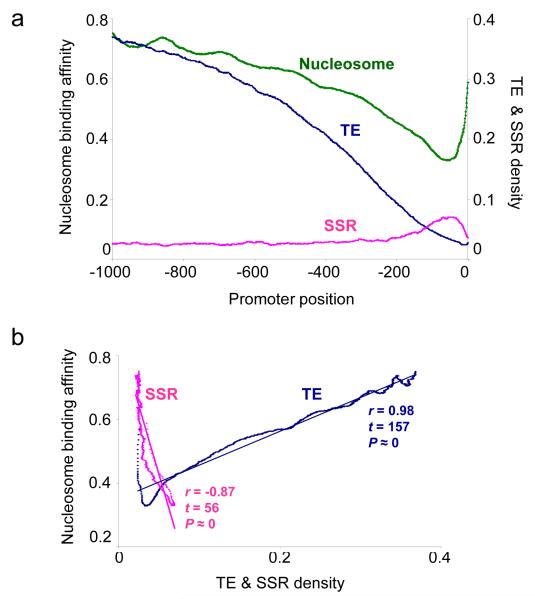
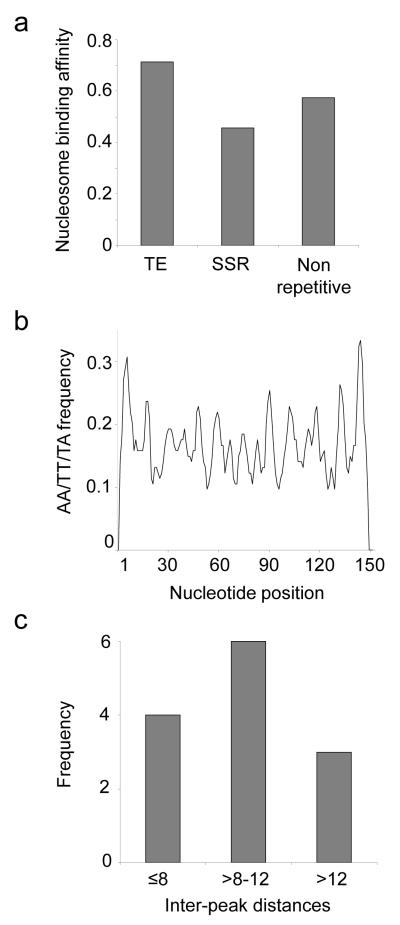
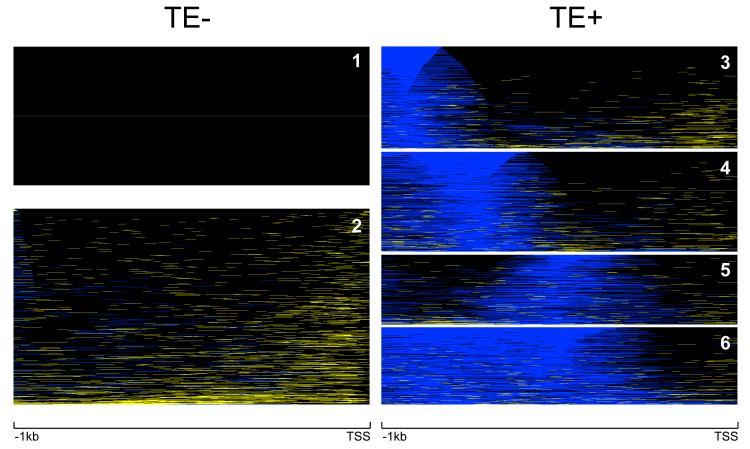
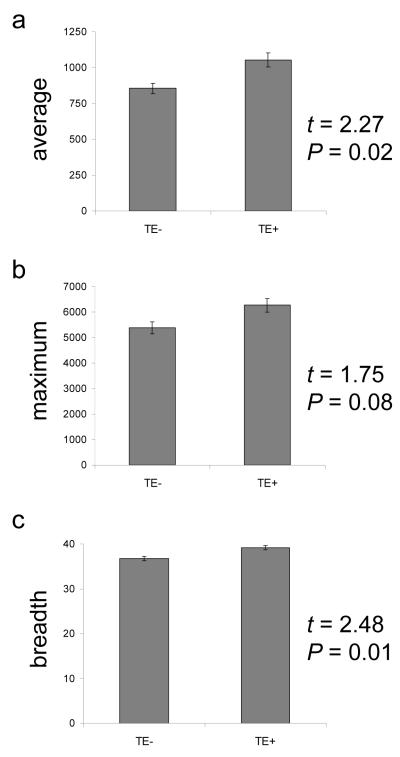
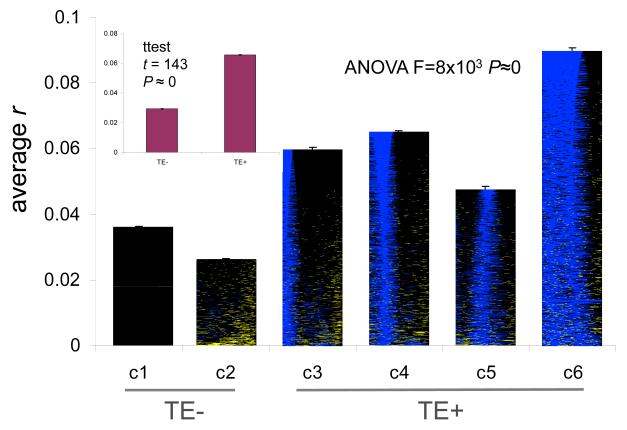
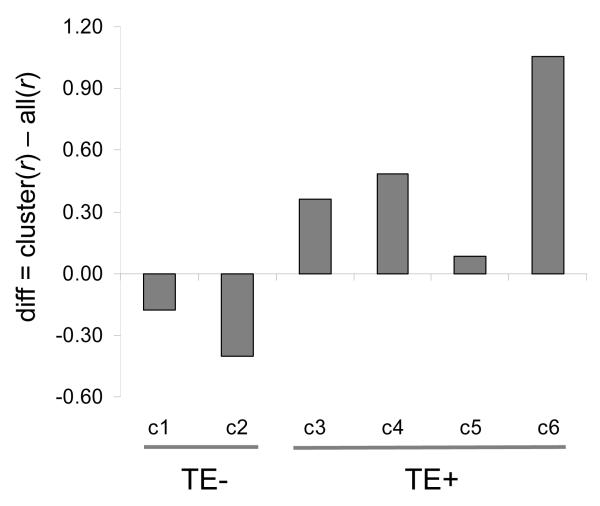
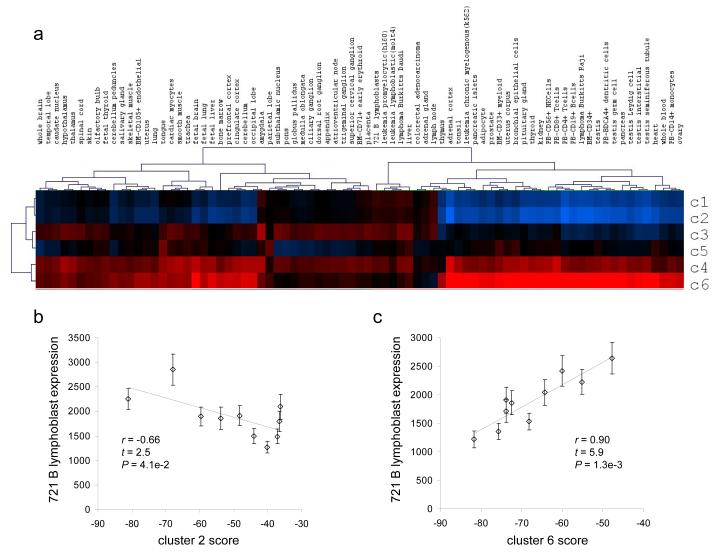
We evaluated the epigenetic contributions of repetitive DNA elements to human gene regulation. Human proximal promoter sequences show distinct distributions of transposable elements (TEs) and simple sequence repeats (SSRs). TEs are enriched distal from transcriptional start sites (TSSs) and their frequency decreases closer to TSSs, being largely absent from the core promoter region. SSRs, on the other hand, are found at low frequency distal to the TSS and then increase in frequency starting approximately 150 bp upstream of the TSS. The peak of SSR density is centered around the -35 bp position where the basal transcriptional machinery assembles. These trends in repetitive sequence distribution are strongly correlated, positively for TEs and negatively for SSRs, with relative nucleosome binding affinities along the promoters. Nucleosomes bind with highest probability distal from the TSS and the nucleosome binding affinity steadily decreases reaching its nadir just upstream of the TSS at the same point where SSR frequency is at its highest. Promoters that are enriched for TEs are more highly and broadly expressed, on average, than promoters that are devoid of TEs. In addition, promoters that have similar repetitive DNA profiles regulate genes that have more similar expression patterns and encode proteins with more similar functions than promoters that differ with respect to their repetitive DNA. Furthermore, distinct repetitive DNA promoter profiles are correlated with tissue-specific patterns of expression. These observations indicate that repetitive DNA elements mediate chromatin accessibility in proximal promoter regions and the repeat content of promoters is relevant to both gene expression and function.


Figures

Figure 1
Figure 1. Repetitive DNA density and nucleosome binding affinity along human proximal promoter sequences
a) Average nucleosome binding affinities (green line, values on left y-axis) along with average TE densities (blue line, values on right y-axis) and average SSR densities (pink line, values on right y-axis) over 7,913 human proximal promoter sequences are plotted over each promoter position starting from -1,000bp upstream and progressing to the transcriptional start site (TSS at position 0). b) Linear trends and correlations relating position-specific nucleosome binding affinities (y-axis) to TE (blue) and SSR (pink) densities (x-axis) are shown. Statistical significance levels of the r-values are based on the Student’s t-distribution with df = n-2 = 998 where t = r*sqrt((n-2)/(1−r2)).
Figure 2
Figure 2. Nucleosome binding properties for repetitive versus non-repetitive DNA
a) Average predicted nucleosome binding affinities are shown for TE, SSR and non-repetitive human promoter sequences. b) Periodicity of the nucleosome binding (wrapping) characteristic dinucleotides AA/TT/TA are shown for 39 experimentally characterized nucleosome bound TE sequences from chicken. c) Histogram showing the inter-peak distances for AA/TT/TA dinucleotides.
Figure 3
Figure 3. Clusters of human proximal promoters based on their repetitive DNA sequence distributions
Proximal promoter sequences are represented left-to-right from position -1,000bp upstream to the transcriptional start site (TSS). Promoter sequences are color coded according to their repeat element distributions. Individual promoter nucleotide positions occupied by TEs are shown in blue, SSR positions are shown in yellow and non-repetitive positions are shown in black. The vertical size of the clusters corresponds to the number of sequences in each cluster. There are two (c1 & c2) clusters that contain promoters largely devoid of TE sequences (TE−), and the promoter sequences of the remaining four clusters (TE+, c3 — c6) contain increasing numbers of TEs.
Figure 4
Figure 4. Gene expression comparison for TE− versus TE+ promoter clusters
Human gene expression data are from the Novartis mammalian gene expression atlas version 2 (GNF2). a) Average level of expression, (b) maximum level of expression and (c) breadth of expression across 79 human tissues (cells) are compared for genes that have TE− versus TE+ promoter sequences. Statistical significance levels are based on the Student’s t-test.
Figure 5
Figure 5. Gene co-expression for repeat-specific proximal promoter clusters
Average pairwise Pearson correlation coefficients (r) for gene expression across 79 human tissues are shown for clusters 1-6 (see Figure 3) as well as for the TE− versus TE+ clusters (inset). Statistical significance levels are based on ANOVA for multiple comparisons and on the Student’s t-test for the TE− versus TE+ comparison.
Figure 6
Figure 6. Differences in gene co-expression between cluster-specific gene pairs versus all possible pairs of genes
Average pairwise Pearson correlations (r) for gene expression across 79 human tissues were measured for all possible gene pairs and this value was subtracted from the average pairwise r-values for genes within each repeat-specific cluster (c1 — c6). A negative value indicates that genes within the cluster have less similar co-expression than background, whereas a positive value indicates that genes within a cluster are more highly co-expressed than expected.
Figure 7
Figure 7. Promoter repetitive DNA architecture and tissue-specific gene expression
Probabilistic models were used to represent the repetitive DNA architectures of each repeat-specific cluster (see Figure 3 and Supplementary Figure 2). Cluster-specific probabilistic models were used to score individual promoter sequences in terms of how closely they resemble a given cluster (Materials and Methods). Vectors of cluster-specific gene scores were correlated with vectors of gene expression values specific human tissues. a) A heat map illustrating the relative correlation values between gene (promoter)-specific scores for each cluster and tissue-specific gene expression values for the 79 tissues in the Novartis gene expression atlas version 2 (GNF2). Relatively high (positive) correlations between gene-cluster scores and gene expression levels are shown in red and low (negative) correlations are shown in blue. Two specific examples of such correlations are shown in panels b & c. b) Gene (promoter)-specific scores based on the probabilistic model for cluster 2 are negatively correlated with gene expression levels in a B lymphoblast cell line. c) Gene (promoter)-specific scores based on the probabilistic model for cluster 6 are positively correlated with gene expression levels in a B lymphoblast cell line. In other words, genes with repetitive DNA promoter profiles that most closely resemble cluster 6 are more highly expressed in the B lymphoblast cell line, whereas genes with repetitive DNA promoter profiles that resemble cluster 2 have lower levels of B lymphoblast expression.

References

    1. Ashburner M, Ball CA, Blake JA, Botstein D, Butler H, Cherry JM, Davis AP, Dolinski K, Dwight SS, Eppig JT, Harris MA, Hill DP, Issel-Tarver L, Kasarskis A, Lewis S, Matese JC, Richardson JE, Ringwald M, Rubin GM, Sherlock G. Gene ontology: tool for the unification of biology. The Gene Ontology Consortium. Nat Genet. 2000;25:25–9. - PMC - PubMed
    1. Azuaje F, Wang H, Bodenreider O. Onotlogy-driven similarity approaches to supporting gene functional assessment. Proc ISMB SIG meeting on Bio-ontologies. 2005;2005:9–10.
    1. Bejerano G, Lowe CB, Ahituv N, King B, Siepel A, Salama SR, Rubin EM, Kent WJ, Haussler D. A distal enhancer and an ultraconserved exon are derived from a novel retroposon. Nature. 2006;441:87–90. - PubMed
    1. Borchert GM, Lanier W, Davidson BL. RNA polymerase III transcribes human microRNAs. Nat Struct Mol Biol. 2006;13:1097–101. - PubMed
    1. Britten RJ, Kohne DE. Repeated sequences in DNA. Hundreds of thousands of copies of DNA sequences have been incorporated into the genomes of higher organisms. Science. 1968;161:529–40. - PubMed

Publication types

LinkOut - more resources