Review
. 2009 Dec;258(1-2):89-99.
doi: 10.1016/j.heares.2009.04.009. Epub 2009 Apr 22.

Interactions of auditory and visual stimuli in space and time

Affiliations
Review

Interactions of auditory and visual stimuli in space and time

Gregg H Recanzone. Hear Res. 2009 Dec.

Abstract

The nervous system has evolved to transduce different types of environmental energy independently, for example light energy is transduced by the retina whereas sound energy is transduced by the cochlea. However, the neural processing of this energy is necessarily combined, resulting in a unified percept of a real-world object or event. These percepts can be modified in the laboratory, resulting in illusions that can be used to probe how multisensory integration occurs. This paper reviews studies that have utilized such illusory percepts in order to better understand the integration of auditory and visual signals in primates. Results from human psychophysical experiments where visual stimuli alter the perception of acoustic space (the ventriloquism effect) are discussed, as are experiments probing the underlying cortical mechanisms of this integration. Similar psychophysical experiments where auditory stimuli alter the perception of visual temporal processing are also described.
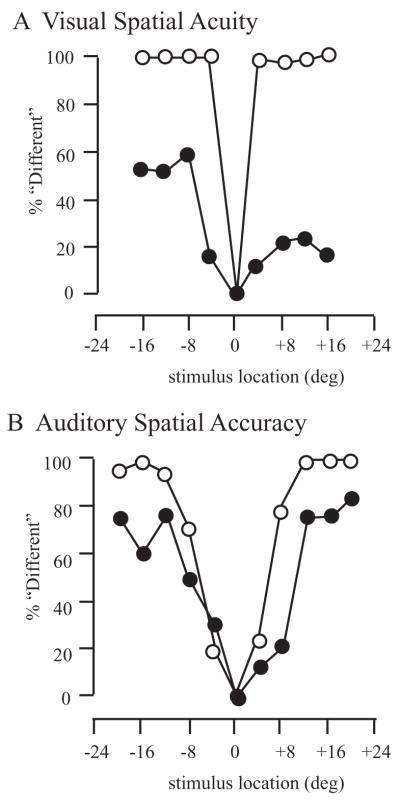

Figures

Figure 1
Figure 1
Temporal integration of auditory and visual signals. A. Psychometric function showing the percent of trials in which the subject perceived that the 200 msec duration auditory and visual stimuli were presented at the same time. Negative values on the x-axis correspond to trials where the visual stimuli were presented before the auditory stimuli. Vertical lines above 0 on the x-axis show the differences between visual leading (leftward horizontal line) and auditory leading (rightward horizontal line) trials where the temporal disparity was 50 msec (top), 100 msec (middle) and 150 msec (bottom). Performance was much better for visual leading stimuli. B. Effect of temporal disparity in discriminating a change in the spatial location of the auditory stimuli. Only auditory leading stimuli were used.
Figure 2
Figure 2
Visual and auditory spatial acuity in a patient with bilateral parietal lobe lesions. A. The visual acuity was measured in a same/different task. Open symbols show age and gender matched controls. Closed symbols show data from R.M. R.M. had an overall deficit in visual spatial acuity, particularly in the right hemifield. B. Auditory spatial acuity. R.M. again had a deficit relative to controls, but not as great and his acuity in the right hemifield was better than his visual acuity in that hemifield. The y-axis shows the percent of time the subject responded that the second stimulus was presented from a different location than the first.
Figure 3
Figure 3
Influence of combined auditory and visual stimuli. A. Visual spatial acuity was tested when auditory stimuli were presented at the same location and at the same time. Thin grey line: visual only trials in age and gender matched controls. Open circles show data when auditory and visual stimuli were presented simultaneously in control subjects. Grey circles show visual only trials in R.M. and solid circles show the combined auditory and visual trials for R.M. There is significant improvement in performance in the right hemifield for R.M. B. Auditory spatial accuracy. There was a small improvement in performance in the control subjects on auditory plus visual trials (open circles) compared to auditory alone (gray line). This was not seen in R.M. C. Performance of young control subjects. In these subjects, there was no influence of auditory stimuli on visual acuity (gray line and open circles overlap), but there was a clear improvement in auditory performance with combined visual stimuli.
Figure 4
Figure 4
Ventriloquism aftereffect in human subjects. A. Single trial data for five representative locations in a single subject before (long ovals) and after (short ovals) 8 degree training. The solid gray bar shows the stimulus location, data are offset vertically for clarity. Before training, estimates were centered near the actual location except for the most peripheral ones. After 20 minutes of exposure to auditory stimuli where visual stimuli were presented 8 degrees to the right across all these locations, the spatial percept was shifted to the right (post-training). B. regression of the mean head location before aftereffect training (x-axis) and after (y-axis). Data are taken from three subjects in three different training sessions. The regression line is shown in the inset. Across locations, there was nearly an 8 degree shift in spatial perception, consistent with the 8 degree visual disparity during training. C. Similar analysis when the subjects were tested at 750 Hz and the disparity training was done at 1500 Hz or the reverse. In this case, there was no consistent shift in the estimates by these observers.
Figure 5
Figure 5
Ventriloquism aftereffect in rhesus monkeys. A. Psychometric functions where the monkey was required to respond whether a single auditory stimulus was presented to the left or right of the midline before training (open circles) and after training at a 4 degree visual disparity (closed circles). Arrows show the two locations during the post-training where the animal was rewarded regardless of the response. There is a clear shift to the right, corresponding to the disparity between the two stimuli during the training period. B. Data from the same monkey. In this case, the post-training data were collected immediately after the training period and before the data shown in panel A were collected. In this case, the test frequency was different than the training frequency and there was no shift in the psychometric function. C. summary across sessions when the auditory stimulus used in the training was the same (black circles) or different (grey circles). Across sessions, the effect was much greater when the test and training stimuli were the same frequency compared to when they were one octave apart.
Figure 6
Figure 6
Representative spectral tuning functions from single neurons in the macaque auditory cortex. A. Tuning functions from two different A1 neurons. Shaded regions show areas where there was at least 25% of the maximum response. Stimuli were 50 msec tone pips that spanned several octaves in frequency and 10 – 90 dB in intensity. Open circles correspond to the stimulus frequency (750 and 1500 Hz) and intensity (65 dB SPL) of the stimuli used in the ventriloquism experiments in human subjects shown in Fig. 4. There is no overlap of these two frequencies for these neurons. B. Single neuron taken from the caudomedial field (CM). This neuron had a sharp tuning function similar to A1 neurons. C. Single neuron from CM with a broad tuning function. This neuron responded to frequencies spanning several octaves and had an equivalent response to the stimuli used in the ventriloquism experiments.
Figure 7
Figure 7
Spatial tuning of A1 and CM neurons. A and B show the results from a single neuron when stimuli were presented in frontal space. Each circle shows the firing rate in spikes per stimulus for each of nine different frontal locations. The A1 neuron had much more variability in the response compared to the CM neuron (note difference in the y-axis). For each of these functions, regression analysis provided a regression line slope. C and D: frequency distribution of the regression line slopes across all recorded A1 and CM neurons. The population of CM neurons had a more examples where the slope was greater than 2%/degree, although such neurons remained a minority.
Figure 8
Figure 8
Auditory influences on visual temporal rate perception. A. Psychometric functions averaged across 8 subjects performing the ‘attend auditory’ experiment when auditory alone stimuli were presented (black circles) and the same subjects performing the ‘attend visual’ experiment when visual alone stimuli were presented (open circles). Subjects are much better at auditory temporal rate discrimination compared to visual temporal rate. B. Interleaved trials in the ‘attend visual’ experiment when auditory stimuli were presented at the same rate as the visual stimuli. The functions for the auditory-alone and visual-alone trials were taken from panel A and are shown as grey lines. Subjects performed as well as they did on auditory alone trials. C. Interleaved trials where the visual stimulus was presented at 4 Hz in both sequences but the auditory stimulus changed in temporal rate. The horizontal grey line is what is predicted if the auditory stimulus had no influence on visual temporal rate perception. Instead, there was a strong influence on performance by the auditory stimulus. D. Interleaved trials where the auditory stimulus was presented at 4 Hz in both sequences but the visual stimulus changed in temporal rate. Here, the influence of the auditory stimulus severely disrupted performance.
Figure 9
Figure 9
Control experiments for auditory influences on visual temporal rate discrimination. A. Psychometric functions for subjects during visual only trials (open circles) and trials where an auditory stimulus is presented continuously throughout the visual stimulus sequence (gray circles). There is no difference between these two functions. B. Similar experiment where the auditory stimulus was presented at about twice the rate of the visual stimulus (8 Hz). Again there is no difference between the two functions. Error bars are smaller than the symbol size.
Figure 10
Figure 10
Auditory – visual interactions when both stimuli are attended. A. Psychometric function when subjects are asked to report whether the sequence of auditory and visual stimuli are presented at the same time or different times. Stimuli were at the same rate for 3.0, 4.0 and 5.4 Hz (grey circles). All other trials the visual stimulus was presented at 4.0 Hz and the auditory stimulus varied in rate. The grey line reproduces the function when visual only stimuli were discriminated. The auditory stimulus has a strong influence on visual temporal rate perception. B. Demonstration of the temporal aftereffect illusion. Open symbols show the pre-training function similar to that seen in panel A. Closed symbols show the results following training where the auditory stimulus was presented at a faster rate than the visual stimulus. There is a shift to the right of this curve corresponding to a increased perception of the visual temporal rate.

Similar articles

Cited by

References

    1. Abel SM, Giguere C, Consoli A, Papsin BC. The effect of aging on horizontal plane sound localization. J Acoust Soc Amer. 2000;108:743–752. - PubMed
    1. Alais D, Burr D. The ventriloquist effect results from near-optimal bimodal integration. Curr Biol. 2004;14:257–262. - PubMed
    1. Altshuler MW, Comalli PE. Effect of stimulus intensity and frequency on median horizontal plane sound localization. J Auditory Res. 1975;15:262–265.
    1. Barraclough NE, Xiao D, Baker CI, Oram MW, Perrett DI. Integration of visual and auditory information by superior temporal sulcus neurons responsive to the sight of actions. J Cog Neurosci. 2005;17:377–391. - PubMed
    1. Beauchamp MS. See me, hear me, touch me: multisensory integration in lateral occipital-temporal cortex. Curr Opin Neurobiol. 2005;15:145–153. - PubMed