. 2009 Apr 24;34(2):234-49.
doi: 10.1016/j.molcel.2009.02.022.

The structure of a receptor with two associating transmembrane domains on the cell surface: integrin alphaIIbbeta3

Affiliations

The structure of a receptor with two associating transmembrane domains on the cell surface: integrin alphaIIbbeta3

Jieqing Zhu et al. Mol Cell. .

Abstract

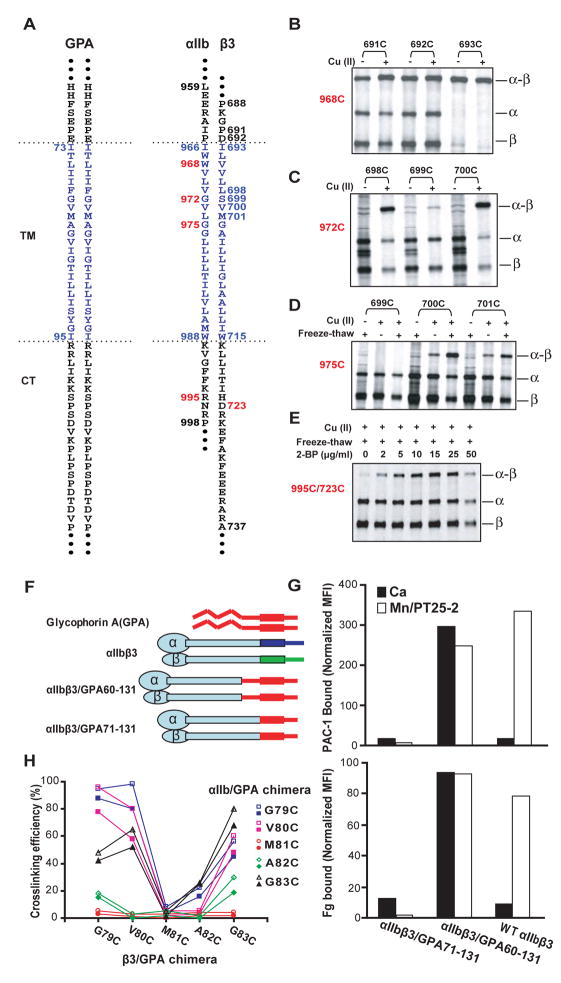
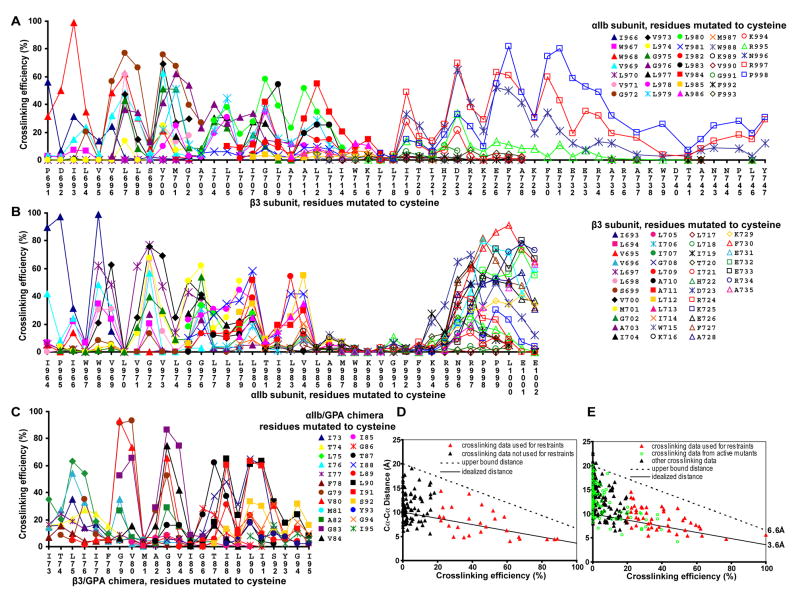
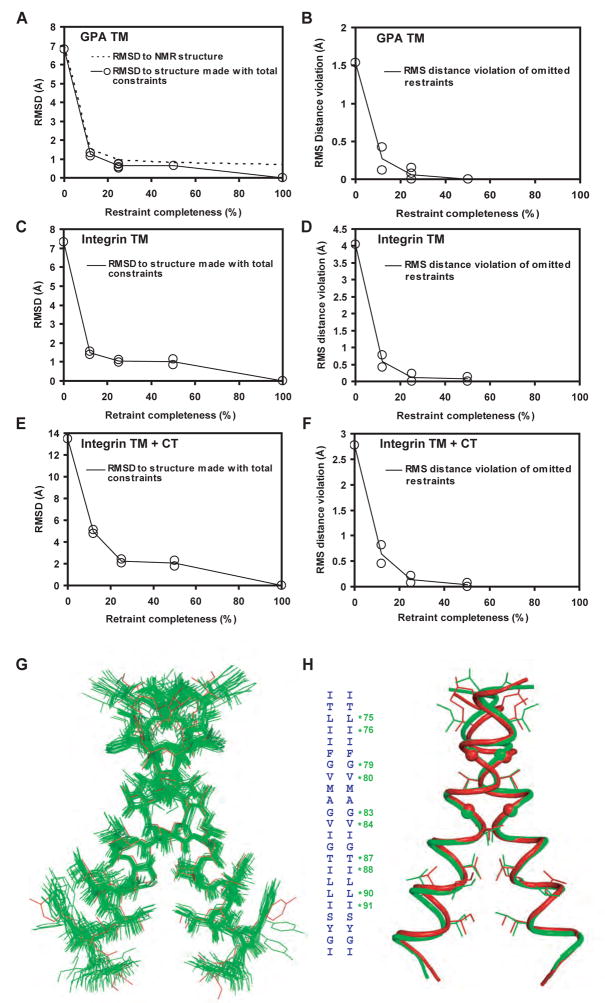
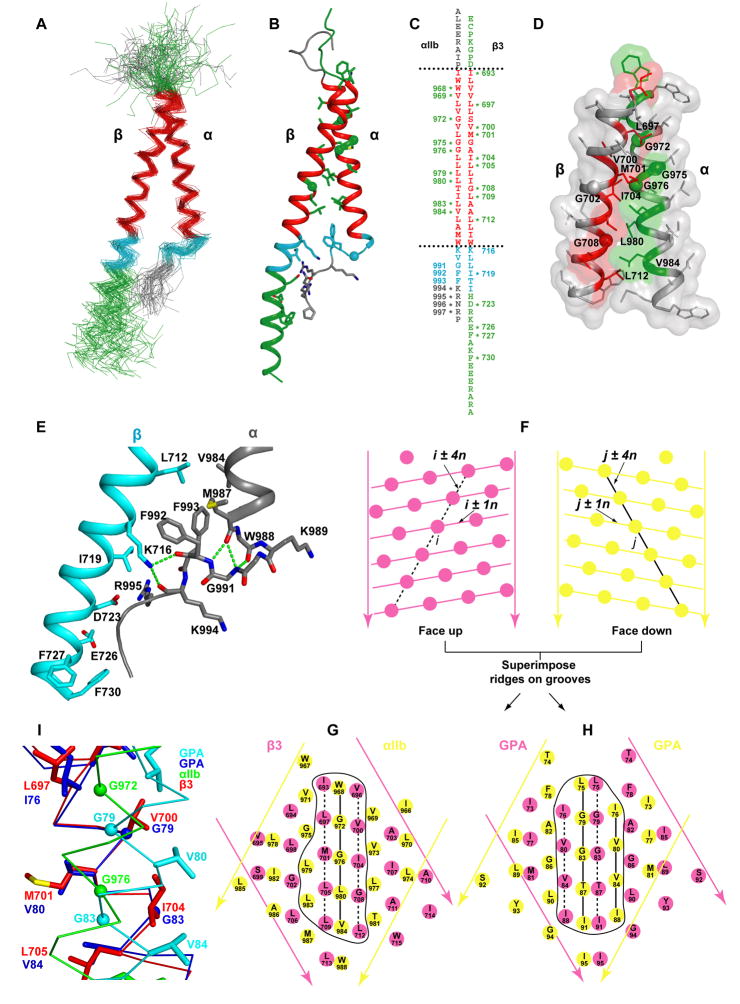
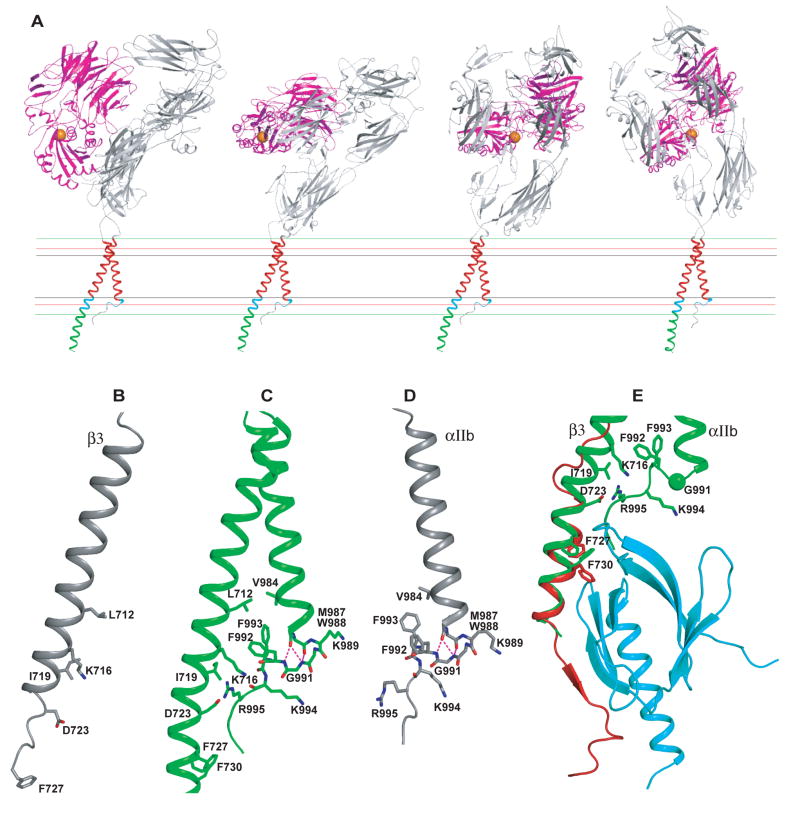
Structures of intact receptors with single-pass transmembrane domains are essential to understand how extracellular and cytoplasmic domains regulate association and signaling through transmembrane domains. A chemical and computational method to determine structures of the membrane regions of such receptors on the cell surface is developed here and validated with glycophorin A. An integrin heterodimer structure reveals association over most of the lengths of the alpha and beta transmembrane domains and shows that the principles governing association of hetero and homo transmembrane dimers differ. A turn at the Gly of the juxtamembrane GFFKR motif caps the alpha TM helix and brings the two Phe of GFFKR into the alpha/beta interface. A juxtamembrane Lys residue in beta also has an important role in the interface. The structure shows how transmembrane association/dissociation regulates integrin signaling. A joint ectodomain and membrane structure shows that substantial flexibility between the extracellular and TM domains is compatible with TM signaling.


Figures

Figure 1
Figure 1. Disulfide crosslinking in native cell membrane
A. Sequences of GPA and αIIbβ3 integrin TM and cytoplasmic domains. Numbers in red show positions tested in panels B–E. B–E. Disulfide crosslinking of αIIbβ3 with indicated cysteine mutations in 293T transfectants, with or without Cu-phenanthroline, freeze-thaw, and 2-BP treatment as indicated. Immunoprecipitated 35S-labeled material was subjected to nonreducing SDS-PAGE and autoradiography. Positions of αIIb (α), β3 (β) and αIIbβ3 heterodimer (α-β) are shown. F. Integrin αIIbβ3/GPA chimeras. G. Ligand binding by chimeras. Binding of ligand mimetic PAC-1 (IgM) (upper panel) or FITC-labeled fibrinogen (Fg) (lower panel) to 293T transfectants was measured in the presence of 1mM Ca2+ or 1mM Mn2+ plus 10 μg/ml activating mAb PT25-2. Binding is expressed as mean fluorescence intensity (MFI) of Fg or PAC-1 relative to MFI of Cy3-labled anti- β3 mAb AP3. H. αIIbβ3/GPA60–131 (closed symbols) and αIIbβ3/GPA71–131 (open symbols) chimeras show similar disulfide crosslinking.
Figure 2
Figure 2. Disulfide crosslinking efficiency and correlation with Cα-Cα atom distance
Disulfide crosslinking in transfectants between subunits with indicated cysteine mutations. As described in Methods, data is with 2-BP, freeze-thaw, and Cu-phenanthroline, except GPA residues 73–80 are with DTT and Cu-phenanthroline. A and B show the same αIIbβ3 disulfide crosslinking data, plotted against β3 (A) or αIIb sequence position (B). C. GPA TM domain disulfide crosslinking in αIIbβ3/GPA71–131 chimera. D and E show the same crosslinking data as in A–C, plotted against Cα-Cα distance. D. Crosslinking efficiency in αIIbβ3/GPA71–131 chimera is plotted against Cα-Cα distance in the GPA solid state NMR structure (Smith et al., 2001). E. Crosslinking efficiency in αIIbβ3 is plotted against Cα-Cα distance in the final integrin structure. Solid lines show the assumed relationship between crosslinking efficiency and Cα-Cα distance, and dashed lines show the distance, above which, restraint violation was penalized in Membrane Rosetta.
Figure 3
Figure 3. Estimation of structure accuracy and validation of the GPA cell surface structure
A–F. Effect of restraint omission. Models were generated using different subsets of 12.5, 25, or 50% of the total restraints as described in the Supplement. A, C and E. Models were compared over Cα atoms to the final structure made with all restraints, and in the case of GPA, also to the GPA NMR structure. By definition, models made with 100% of restraints are identical to the final structure. B, D, and F. Models generated with a subset of restraints were scored for violation of the omitted restraints, i.e., those not used in model generation. The per residue RMS distance violation, i.e., distance above the upper bound (see Fig. 2D and E), is shown. How well the models satisfy omitted restraints is a measure of model accuracy similar to the Rfree value in crystallography. G. The ensemble of 20 GPA Disulfide/Rosetta structures, showing all heavy atoms (green) superimposed on the solid state NMR structure (red). H. Cartoon of the central GPA Disulfide/Rosetta structure (green) superimposed on the solid state NMR structure (red) with sidechains (or spheres for Gly) shown for residues in crosslinking peaks (asterisked in the sequence insert).
Figure 4
Figure 4. Structure of the membrane region of an integrin
A. The disulfide/Rosetta structural ensemble superimposed on the 46-residue TM segments. B. The cluster-center structure. C. The sequences, with residues in crosslinking peaks asterisked. D. Transparent molecular surfaces for αIIb and β3 TM segments with all sidechains shown. In A–D, sidechains and Gly Cα spheres in the crosslinking peaks in the 23 residue hydrophobic segment are shown in red or green. Residues in the cytoplasmic juxtamembrane interface region (18 to 12 Å from the membrane center) are cyan. E. A blow-up of the lower TM, JM, and cytoplasmic segments. Hydrogen bonds are dashed green lines. Nitrogens, oxygens, and sulfurs are blue, red and yellow, respectively. F–H. Crick helical-net diagrams (Chothia et al., 1981). Cylindrical helical surfaces are cut at one position along the circumference, unrolled, and aligned at the helical interfaces. I. Superposition of the integrin and GPA TM helices, on residues that form the two ridges forming the groove in β3 and one GPA monomer in which the GXXXG motifs nestle.
Figure 5
Figure 5. Ligand binding by αIIbβ3 integrin mutants
A. Binding of ligand-mimetic PAC-1 IgM by cysteine-scanning mutants in αIIb (upper panel) and β3 (lower panel). Results in absence (Ca) and presence of activation (Mn/PT25-2) are shown, along with wild-type (WT) and GFFKR/GAAKR mutant controls. Leucine-scanning results from a previous study (Luo et al., 2005) are also plotted. B and C. Effects of other mutations in 293T (B) and CHO-K1 (C) transient transfectants.
Figure 6
Figure 6. Structure in the membrane and comparison to isolated αIIb and β3 TM domains and β3 talin complex
A. Low energy orientations of the αIIbβ3 ectodomain on the cell surface. Four favorable cell surface orientations of intact αIIbβ3 are shown, superimposed on the TM domains. The ligand-binding αIIbβ-propeller and β3 I domains are shown in magenta, and ligand-binding I domain Mg2+ ion as an orange sphere. The outer bounds of the hydrophobic, interface, and polar regions of the membrane are shown as black, red, and green lines, respectively. B–D. The NMR bicelle structures of β3 (Lau et al., 2008b) (B) and αIIb (Lau et al., 2008a) (D) are shown in the same orientation as the subunits of the αIIbβ3 complex (C). E. Superposition on the αIIbβ3 complex of the NMR structure of β3 integrin cytoplasmic tail fragment in complex with talin F3 domain (Wegener et al., 2007). The integrin heterodimer structure is in green. The talin F3 domain is in cyan and the β3 cytoplasmic tail fragment of the NMR structure is in red. The side chains of the two phenylalanine residues (F727 and F730) are shown as sticks.

References

    1. Adair BD, Yeager M. Three-dimensional model of the human platelet integrin αIIbβ3 based on electron cryomicroscopy and x-ray crystallography. Proc Natl Acad Sci USA. 2002;99:14059–14064. - PMC - PubMed
    1. Barth P, Schonbrun J, Baker D. Toward high-resolution prediction and design of transmembrane helical protein structures. Proc Natl Acad Sci USA. 2007;104:15682–15687. - PMC - PubMed
    1. Barth P, Wallner BDB. Prediction of membrane protein structures with complex topologies using limited constraints. Proc Natl Acad Sci USA. 2009;106:1409–1414. - PMC - PubMed
    1. Bass RB, Butler SL, Chervitz SA, Gloor SL, Falke JJ. Use of site-directed cysteine and disulfide chemistry to probe protein structure and dynamics: applications to soluble and transmembrane receptors of bacterial chemotaxis. Methods Enzymol. 2007;423:25–51. - PMC - PubMed
    1. Bocharov EV, Mayzel ML, Volynsky PE, Goncharuk MV, Ermolyuk YS, Schulga AA, Artemenko EO, Efremov RG, Arseniev AS. Spatial structure and pH-dependent conformational diversity of dimeric transmembrane domain of the receptor tyrosine kinase EphA1. J Biol Chem 2008a - PMC - PubMed

Publication types

MeSH terms

Substances

LinkOut - more resources