. 2009 Aug 15;78(4):344-54.
doi: 10.1016/j.bcp.2009.04.016. Epub 2009 Apr 24.

Antimelanoma activity of the redox dye DCPIP (2,6-dichlorophenolindophenol) is antagonized by NQO1

Affiliations

Antimelanoma activity of the redox dye DCPIP (2,6-dichlorophenolindophenol) is antagonized by NQO1

Christopher M Cabello et al. Biochem Pharmacol. .

Abstract

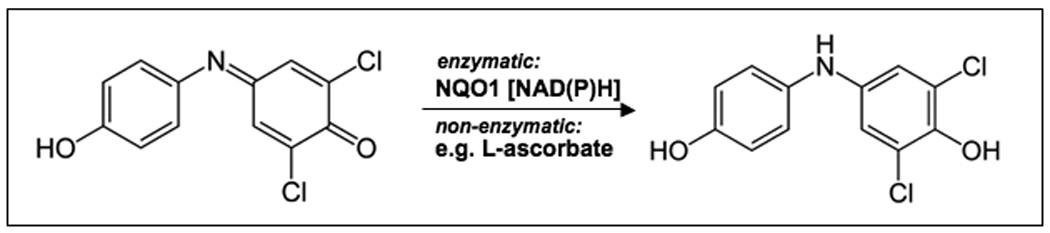
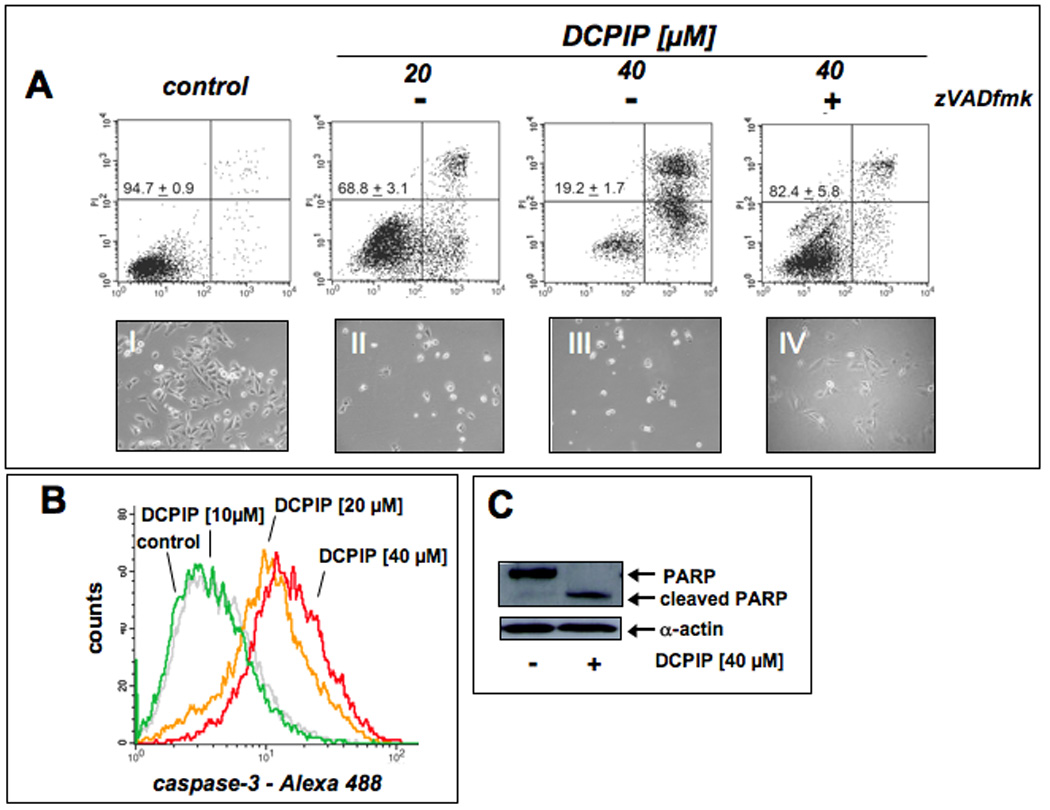
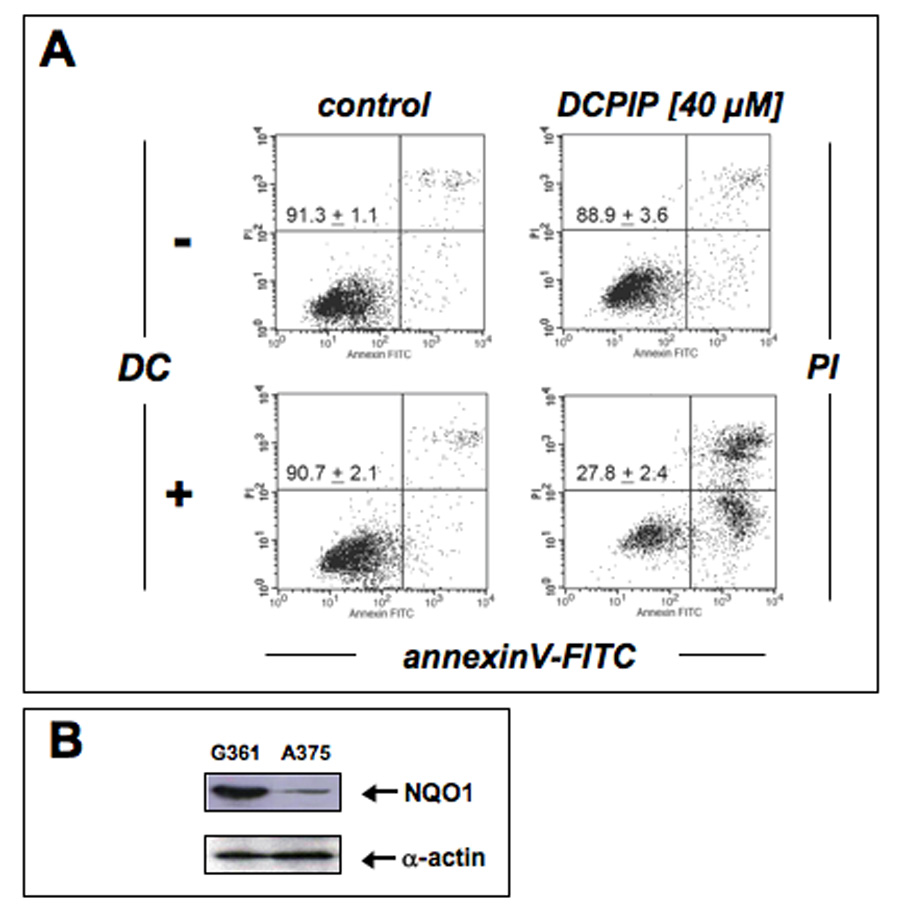
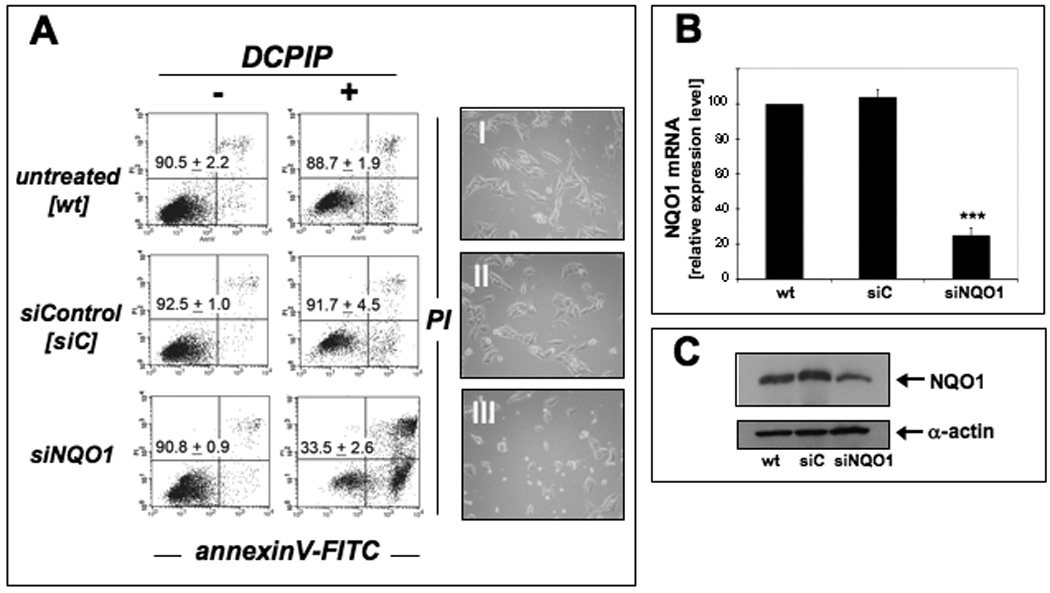
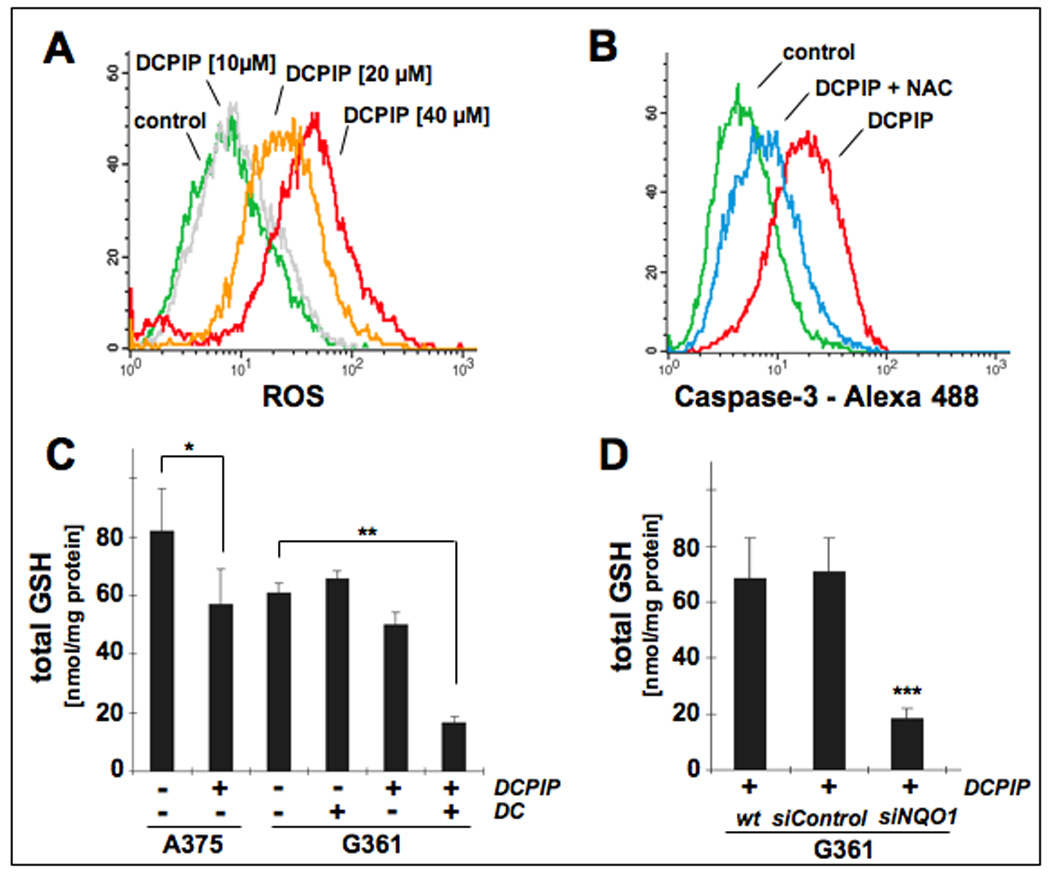
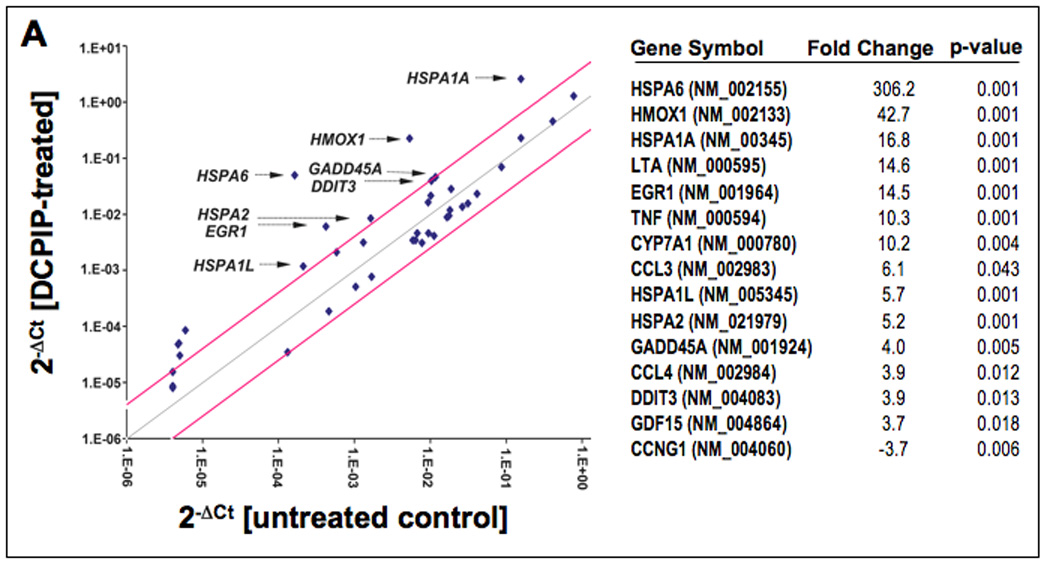
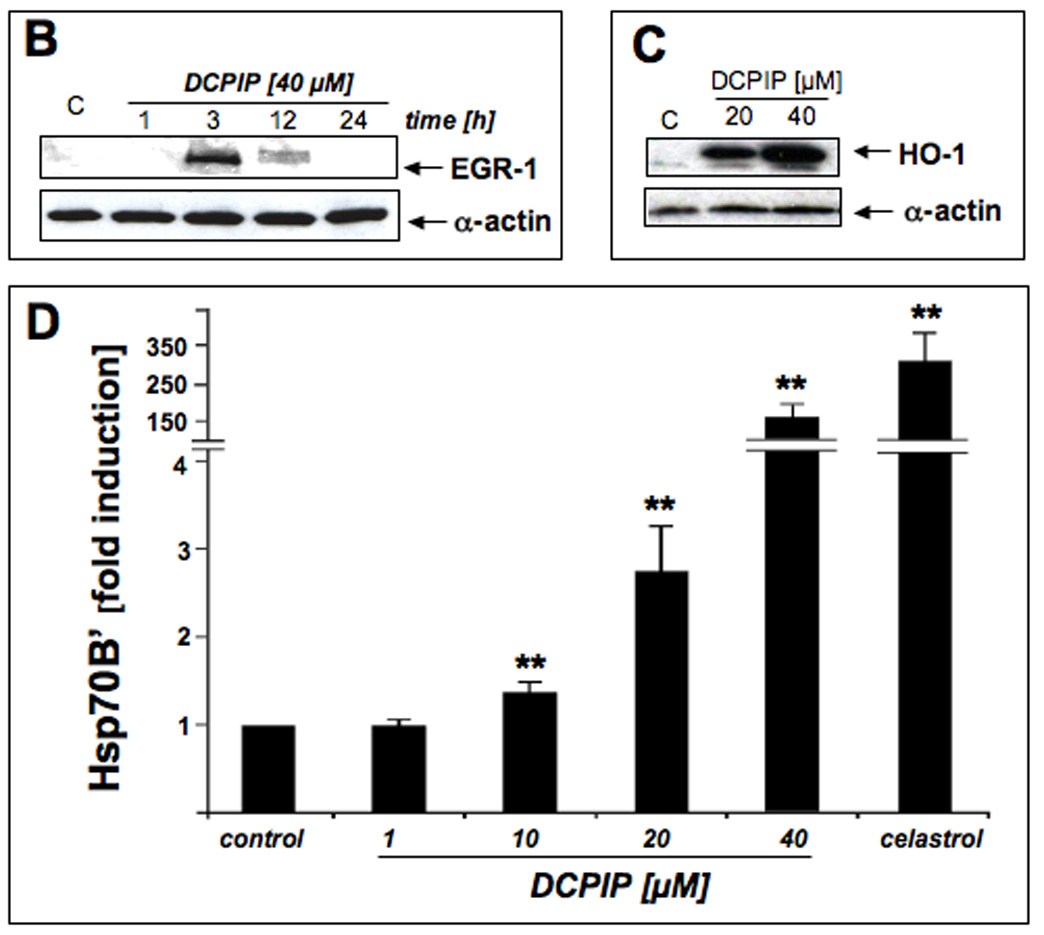
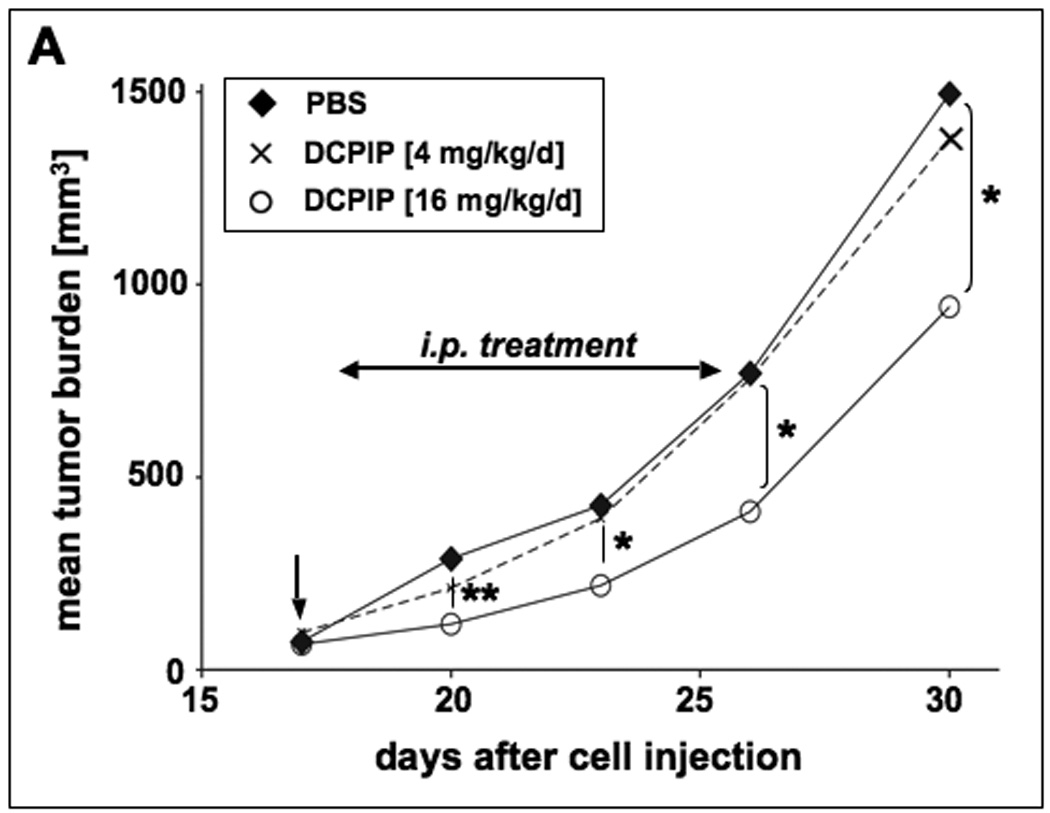
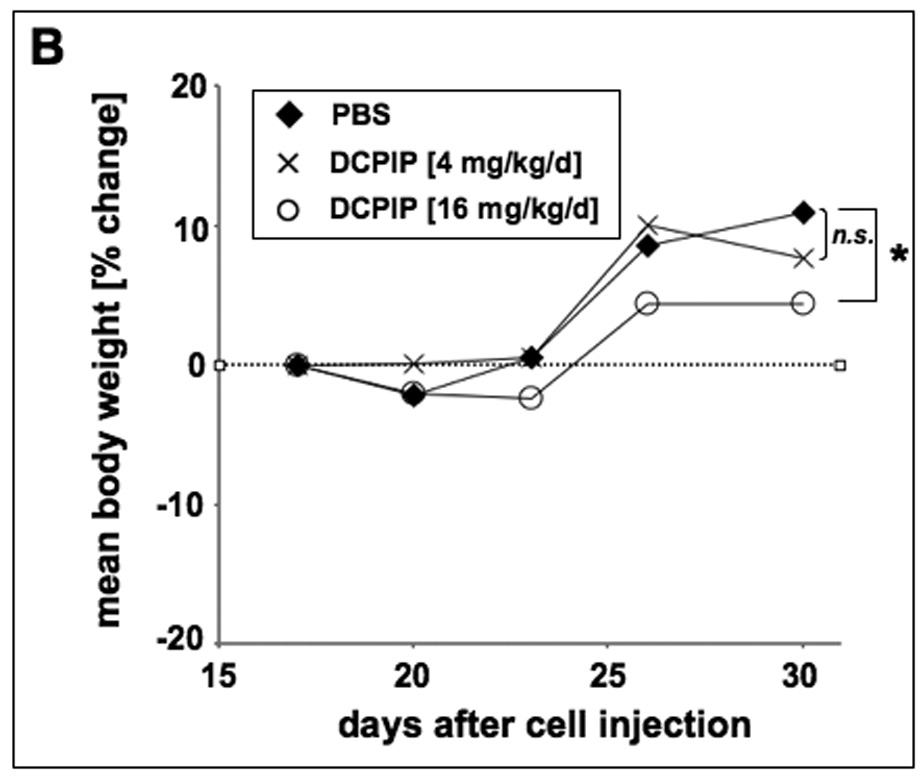
Altered redox homeostasis involved in the control of cancer cell survival and proliferative signaling represents a chemical vulnerability that can be targeted by prooxidant redox intervention. Here, we demonstrate that the redox dye 2,6-dichlorophenolindophenol (DCPIP) may serve as a prooxidant chemotherapeutic targeting human melanoma cells in vitro and in vivo. DCPIP-apoptogenicity observed in the human melanoma cell lines A375 and G361 was inversely correlated with NAD(P)H:quinone oxidoreductase (NQO1) expression levels. In A375 cells displaying low NQO1 activity, DCPIP induced apoptosis with procaspase-3 and PARP cleavage, whereas G361 cells expressing high levels of enzymatically active NQO1 were resistant to DCPIP-cytotoxicity. Genetic (siRNA) or pharmacological (dicoumarol) antagonism of NQO1 strongly sensitized G361 cells to DCPIP apoptogenic activity. DCPIP-cytotoxicity was associated with the induction of oxidative stress and rapid depletion of glutathione in A375 and NQO1-modulated G361 cells. Expression array analysis revealed a DCPIP-induced stress response in A375 cells with massive upregulation of genes encoding Hsp70B' (HSPA6), Hsp70 (HSPA1A), heme oxygenase-1 (HMOX1), and early growth response protein 1 (EGR1) further confirmed by immunodetection. Systemic administration of DCPIP displayed significant antimelanoma activity in the A375 murine xenograft model. These findings suggest feasibility of targeting tumors that display low NQO1 enzymatic activity using DCPIP.


Figures

Figure 1
Figure 1. The dihalogenated benzoquinoneimine redox dye 2,6-dichlorophenolindophenol (DCPIP)
Reduction of the blue dye DCPIP (λmax = 600 nm) with formation of the colorless p-aminophenol hydroquinone leuco form occurs through enzymatic transformation by NAD(P)H quinone oxidoreductase (NQO1) or nonenzymatic reaction with reducing agents such as ascorbic acid.
Figure 2
Figure 2. Exposure to DCPIP dose-dependently induces apoptosis with cleavage of procaspase-3 and PARP in human A375 melanoma cells
(A) Induction of cell death by exposure to increasing doses of DCPIP (20 and 40 µM, 24 h) in the absence or presence of the pancaspase inhibitor zVADfmk was assessed by flow cytometric analysis of annexinV-FITC/propidium iodide-stained cells. The numbers indicate viable cells (AV, PI, lower left quadrant) in percent of total gated cells (mean ± SD, n=3). Representative light microscopy pictures taken after 24 h exposure to DCPIP are shown in panels I-IV. (B) DCPIP-induced (10, 20, and 40 µM, 24 h) caspase-3 activation was examined by flow cytometric detection using an Alexa Fluor 488-conjugated monoclonal antibody against cleaved procaspase-3. One representative experiment of three similar repeats is shown. (C) DCPIP-induced (40 µM, 24 h) PARP cleavage was examined by immunoblot analysis.
Figure 3
Figure 3. Dicoumarol treatment sensitizes human G361 melanoma cells to DCPIP-induced apoptosis
(A) Induction of cell death by exposure to DCPIP (40 µM, 24 h) in the absence or presence of the NQO1 inhibitor dicoumarol (DC, 60 µM) was assessed by flow cytometric analysis of annexinV-FITC/propidium iodide-stained cells. The numbers indicate viable cells (AV, PI, lower left quadrant) in percent of total gated cells (mean ± SD, n=3). (B) NQO1 protein levels in G361 and A375 cells were compared by immunoblot analysis.
Figure 4
Figure 4. Genetic downregulation of NQO1 expression sensitizes human G361 melanoma cells to DCPIP-induced apoptosis
(A) Induction of cell death by exposure to DCPIP (40 µM, 24 h) was examined in G361 wild type cells (untreated, wt) and after control siRNA treatment (siControl, siC) and NQO1 siRNA knockdown (siNQO1). The numbers indicate viable cells (AV, PI, lower left quadrant) in percent of total gated cells (mean ± SD, n=3). Representative light microscopy pictures taken after 24 h exposure to DCPIP are shown in panels I-III. (B) NQO1-Knockdown was confirmed by expression analysis using quantitative RT-PCR (mean ± SD, n=3) and (C) immunoblot analysis as specified in Materials and Methods.
Figure 5
Figure 5. DCPIP induces oxidative stress in human melanoma cell lines
(A) Induction of intracellular oxidative stress in human A375 melanoma cells by treatment with DCPIP. Cells were exposed to DCPIP (10, 20, 40 µM, 24 h) and intracellular oxidative stress was assessed by 2’,7’-dichloro-dihydrofluorescein diacetate staining followed by flow cytometric analysis. One representative experiment of three similar repeats is shown. (B) Antioxidant protection against DCPIP-induced caspase-3 activation. Cells were pretreated with NAC (10 mM, 24 h) or left untreated. After medium change, DCPIP (40 µM) was added and caspase-3 activation was examined after another 24 h by flow cytometric detection using an Alexa Fluor 488-conjugated monoclonal antibody against cleaved procaspase-3. One representative experiment of three similar repeats is shown. (C) Modulation of intracellular glutathione content in A375 and G361 melanoma cells exposed to DCPIP (40 µM, 6h) in the absence or presence of DC (60 µM). Total glutathione content was normalized to protein content. (D) For NQO1 knockdown, G361 melanoma cells were treated with siNQO1- or siControl or left untreated as described in Materials and Methods. Intracellular glutathione content was then determined in G361 melanoma cells exposed to DCPIP (40 µM, 6h). Total glutathione content was normalized to protein content (mean ± SD, n=3).
Figure 6
Figure 6. DCPIP induces oxidative stress and heat shock response gene expression in human A375 melanoma cells
(A) DCPIP-induced gene expression changes in A375 human melanoma cells. The scatter blot (left panel) depicts differential gene expression as detected by the RT2 Human Stress and Toxicity Profiler™ PCR Expression Array technology profiling the expression of 84 (oxidative) stress- and toxicity related genes after DCPIP treatment (40 µM, 24 h). Upper and lower lines represent the cut-off indicating three fold up- or down-regulated expression, respectively. Arrows specify selected genes with at least 4 fold up-regulated expression versus untreated controls. Expression array analysis was performed in three independent repeats and analyzed using the two-sided Student’s t test. The table (right panel) summarizes statistically significant expression changes by at least three fold (p < 0.05). (C) The time course of DCPIP-modulation (40 µM) of early growth response protein 1 (EGR1) levels was examined by immunoblot analysis of total cellular protein extracts. Detection of α-actin expression served as a loading control. (C) DCPIP-modulation (20 and 40 µM, 24 h exposure) of cellular heme oxygenase-1 (HO-1) protein levels were examined in total cellular protein extracts by immunoblot analysis. (D) Modulation of cellular Hsp70B’ protein levels by DCPIP (1, 10, 20, and 40 µM, 24 h) was examined in total cellular protein extracts followed by ELISA analysis as specified in Materials and Methods (mean ± SD, n=3). Treatment with celastrol (2 µM, 24 h exposure) was used as a positive control for pharmacological Hsp70B’ upregulation.
Figure 7
Figure 7. DCPIP inhibits tumor growth in a human A375 melanoma SCID-mouse xenograft model
Human A375 melanoma cells (10 × 106) were implanted s.c. into the right flank of SCID mice. 17 days after cell injection animals were pair-matched (65 mm3 average tumor size) and one day later (vertical arrow) daily treatment (DCPIP: low dose group: 4 mg/kg/d, 100 µl, q.d., n=12; high dose group: 16 mg/kg/d, 200 µl, b.i.d., n=11) was initiated by intraperitoneal injection as specified in Materials and Methods. Control animals (n=12) received PBS only. (A) Tumor growth curves were obtained by determining average tumor volumes until day 30 after cell injection. Data points are depicted as means ± SEM and statistical comparison between individual data points was performed using the two-sided Student’s t test (*, p < 0.05; **, p < 0.01; ***, p < 0.001). (B) Mean body weight was monitored during the duration of the experiment and expressed as % change from the average weight obtained on the day of pairmatching.

Similar articles

Cited by

References

    1. Laurent A, Nicco C, Chereau C, Goulvestre C, Alexandre J, Alves A, et al. Controlling tumor growth by modulating endogenous production of reactive oxygen species. Cancer Res. 2005;65:948–956. - PubMed
    1. Hileman EO, Liu J, Albitar M, Keating MJ, Huang P. Intrinsic oxidative stress in cancer cells: a biochemical basis for therapeutic selectivity. Cancer Chemother Pharmacol. 2004;53:209–219. - PubMed
    1. Cabello CM, Bair WB, Wondrak GT., 3rd Experimental therapeutics: Targeting the redox Achilles heel of cancer. Curr Opin Investig Drugs. 2007;8:1022–1037. - PubMed
    1. Fruehauf JP, Meyskens FL., Jr Reactive oxygen species: a breath of life or death? Clin Cancer Res. 2007;13:789–794. - PubMed
    1. Fruehauf JP, Trapp V. Reactive oxygen species: an Achilles' heel of melanoma? Expert Rev Anticancer Ther. 2008;8:1751–1757. - PubMed

Publication types

MeSH terms