Review
. 2009 Jul;30(2):212-38.
doi: 10.1016/j.yfrne.2009.04.003. Epub 2009 Apr 24.

Protective actions of ovarian hormones in the serotonin system of macaques

Affiliations
Review

Protective actions of ovarian hormones in the serotonin system of macaques

Cynthia L Bethea et al. Front Neuroendocrinol. 2009 Jul.

Abstract

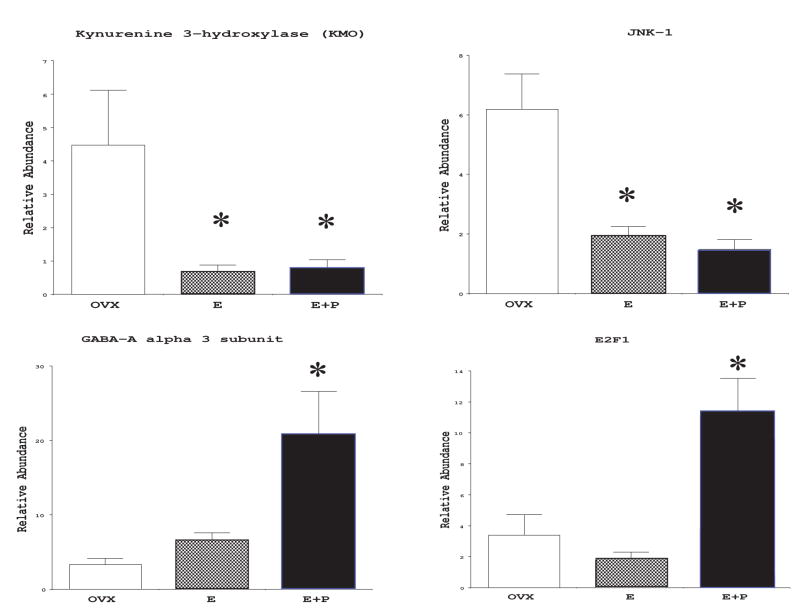
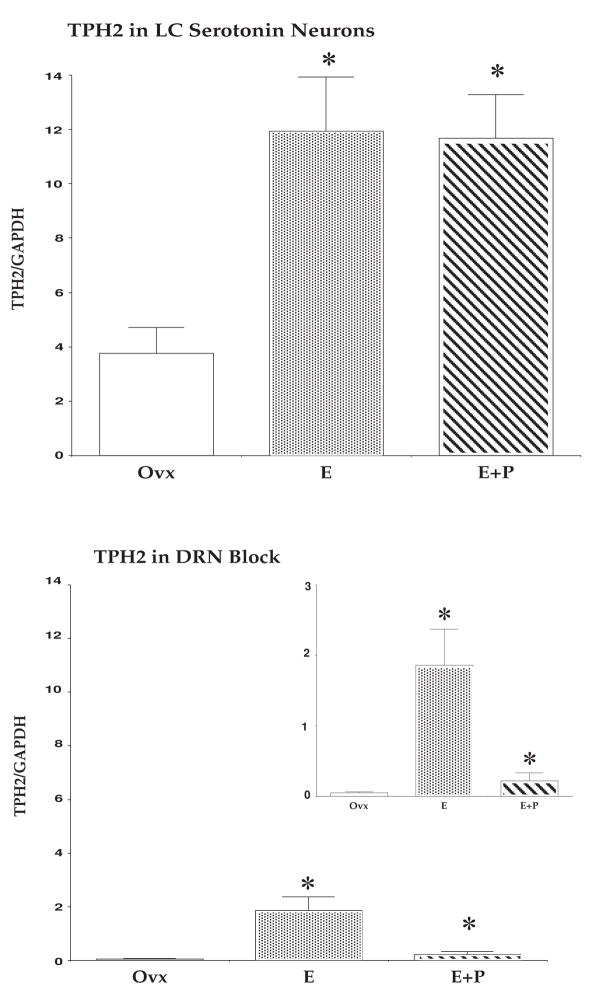
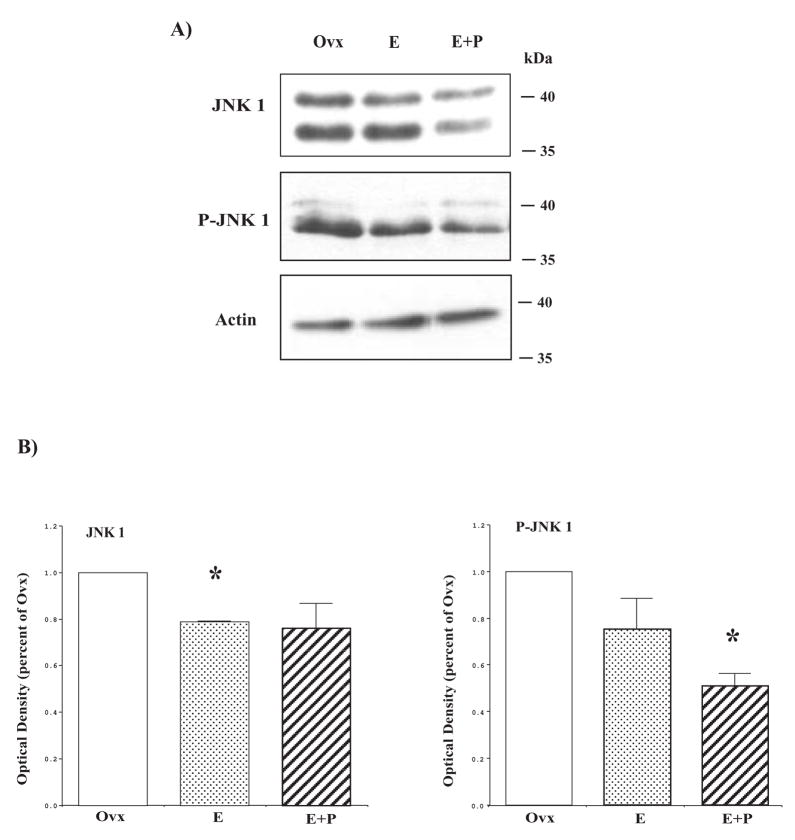
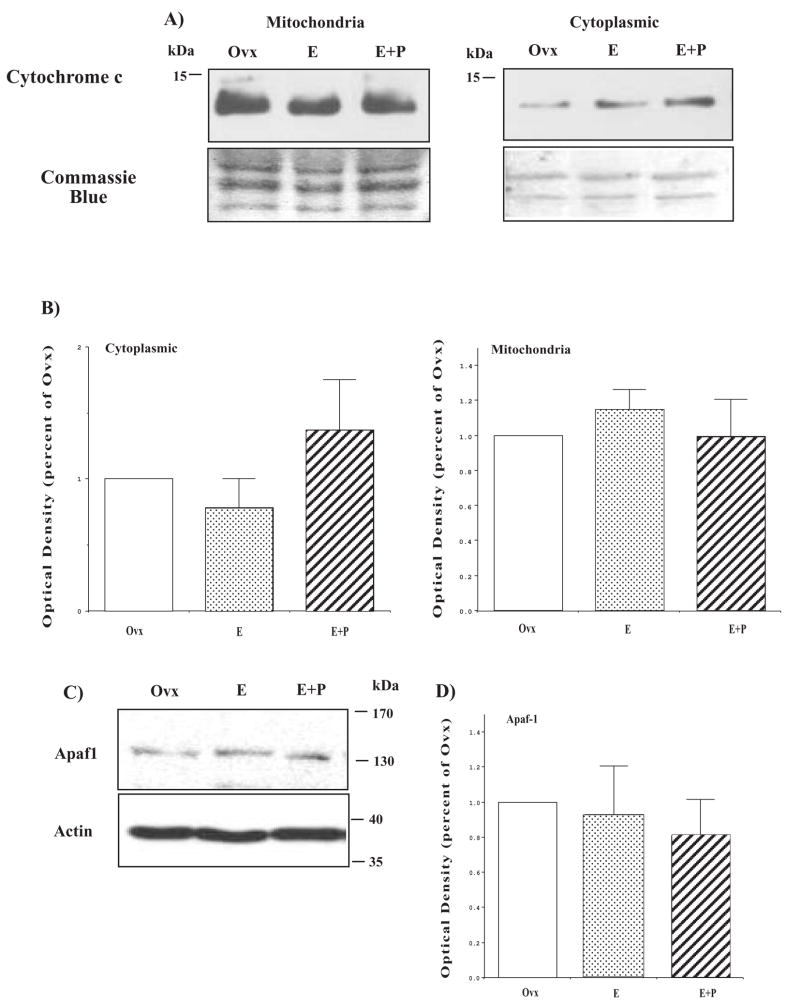
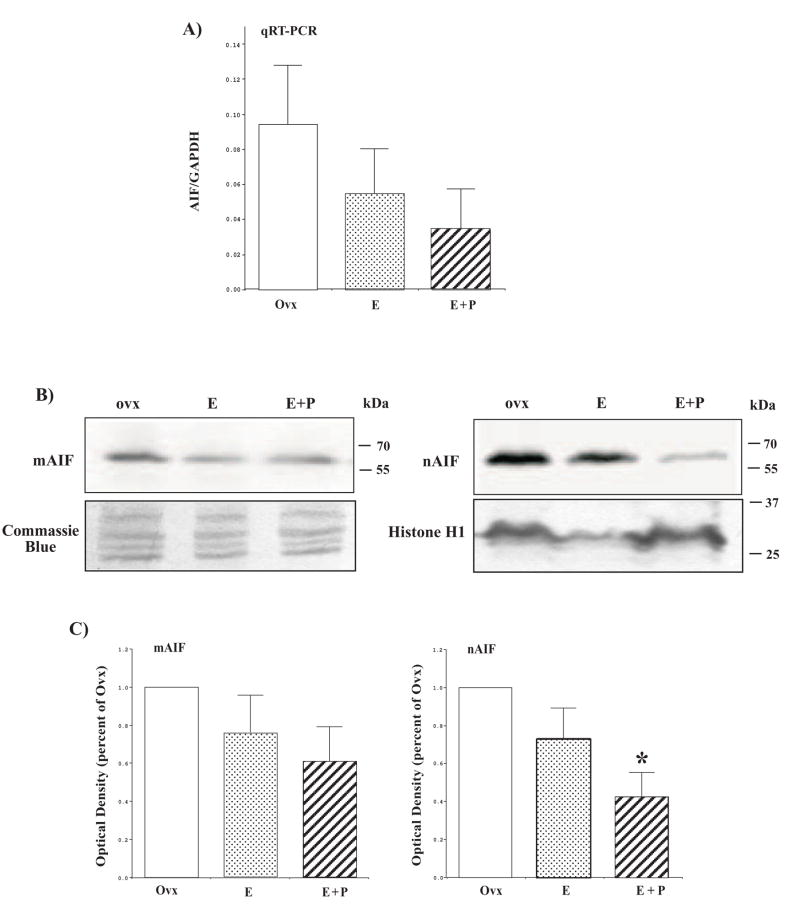
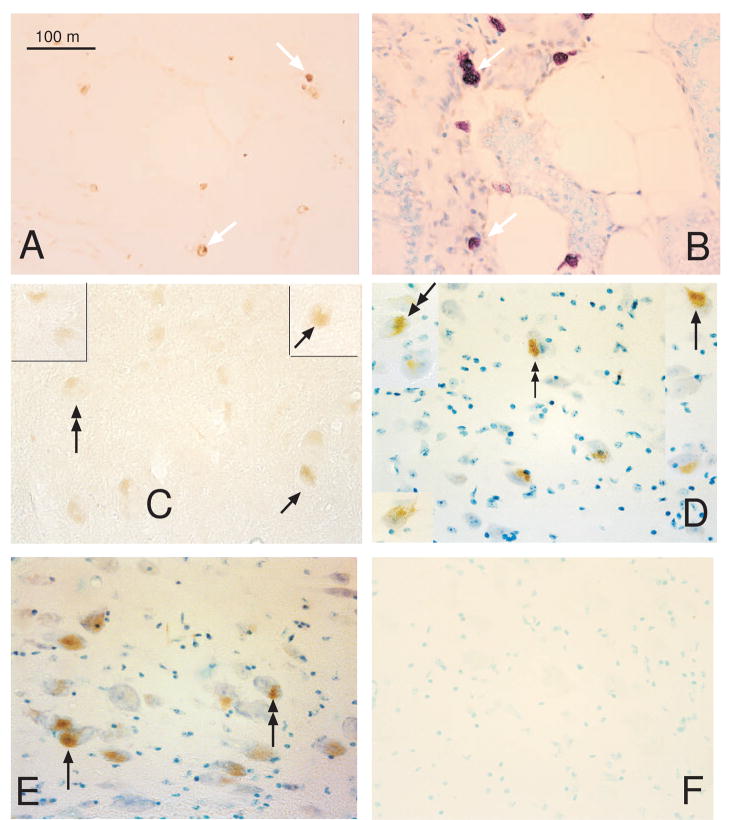
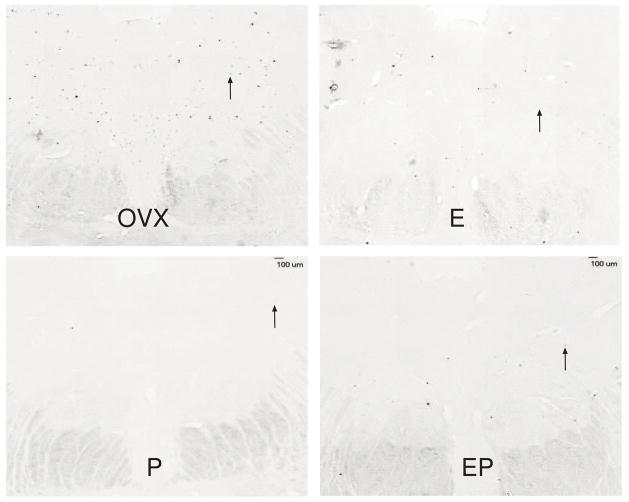
The serotonin neurons of the dorsal and medial raphe nuclei project to all areas of the forebrain and play a key role in mood disorders. Hence, any loss or degeneration of serotonin neurons could have profound ramifications. In a monkey model of surgical menopause with hormone replacement and no neural injury, E and P decreased gene expression in the dorsal raphe nucleus of c-jun n-terminal kinase (JNK1) and kynurenine mono-oxygenase (KMO) that promote cell death. In concert, E and P increased gene expression of superoxide dismutase (SOD1), VEGF, and caspase inhibitory proteins that promote cellular resilience in the dorsal raphe nucleus. Subsequently, we showed that ovarian steroids inhibit pivotal genes in the caspase-dependent and caspase-independent pathways in laser-captured serotonin neurons including apoptosis activating factor (Apaf1), apoptosis-inducing factor (AIF) and second mitochondria-derived activator of caspases (Smac/Diablo). SOD1 was also increased specifically in laser-captured serotonin neurons. Examination of protein expression in the dorsal raphe block revealed that JNK1, phosphoJNK1, AIF and the translocation of AIF from the mitochondria to the nucleus decreased with hormone therapy, whereas pivotal execution proteins in the caspase pathway were unchanged. In addition, cyclins A, B, D1 and E were inhibited, which would prevent re-entry into the cell cycle and catastrophic death. These data indicated that in the absence of gross injury to the midbrain, ovarian steroids inhibit the caspase-independent pathway and cell cycle initiation in serotonin neurons. To determine if these molecular actions prevented cellular vulnerability or death, we examined DNA fragmentation in the dorsal raphe nucleus with the TUNEL assay (terminal deoxynucleotidyl transferase nick end labeling). Ovarian steroids significantly decreased the number of TUNEL-positive cells in the dorsal raphe. Moreover, TUNEL staining prominently colocalized with TPH immunostaining, a marker for serotonin neurons. In summary, ovarian steroids increase the cellular resilience of serotonin neurons and may prevent serotonin neuron death in women facing decades of life after menopause. The survival of serotonin neurons would support cognition and mental health.


Figures

Figure 1
Figure 1
Histograms illustrating the relative abundance of mRNAs for KMO-1, JNK1, GABA-Aα3 and E2F1 in ovariectomized monkeys treated with placebo (OVX), E or E+P. There were 3 monkeys in each group and the bars on each column represent the standard error of the mean within the group. Asterisks illustrate that the treated group was significantly different from the placebo group by Student Newman Keul’s post-hoc pairwise comparison at p < 0.05 after the groups were found to differ significantly with ANOVA (JNK-1, p < 0.007; KMO, p < 0.05; GABA-Aα3, p < 0.02; E2F1, p < 0.009). The relative abundance of each transcript was determined with qRT-PCR and was normalized with GAPDH. (reprinted from [32])
Figure 2
Figure 2
Diagrammatic representation of hormone therapy-induced changes in gene expression in the dorsal raphe block. Genes that exhibited a significant increase (p< 0.05, ANOVA) are shown in RED and genes that exhibited a significant decrease (p< 0.05, ANOVA) are shown in BLUE. Green blocks outline gene changes that were previously confirmed with qRT-PCR. Other information is shown in black. Arrows indicate downstream drive or activation, whereas t-bars indicate downstream blockade. Significant increases in expression were observed in vascular endothelial growth factor (VEGF), fibroblast growth factor receptor 2 (FGF-R2), nerve growth factor receptor associated protein (NGFR-AP), Ras protein-specific quanine nucleotide-releasing factor 1(RAS GRF), MAP kinase kinase 5 (MAP2K5), superoxide dismutase (SOD1) and in 2 ubiquinases (UCHL1 and UBCH7). Also, gene expression significantly increased for 3 proteins called baculovirus IAP repeat containing 4 (BIRC4 or XIAP), BCL2-related protein (MCL-1) and bifunctional apoptosis regulator (BFAR) that are capable of inhibiting caspases. Significant decreases in expression were observed in members of the cytokine signaling pathway including chemokine ligand 12 (CXCL12), TGF-β receptor 3 (TGFβ3), tumor necrosis factor α induced protein (TNFAIP6), member 21 of the TNF superfamily (TNFRSF21), the prostaglandin F receptor (PTGFR) and Fas associated factor 1 (FAF1). Significant decreases were also observed in downstream effectors of cell death including p21-activated kinase 2 (PAK), MAP kinase kinase 4 (MAP2K4) and nibrin (NBSI). The pro-apoptosis gene PDCD4 (programmed cell death 4) was significantly decreased as well. With qRT-PCR we previously found that expression of kynurenin mono-oxygenase (KMO), which produces neurotoxic metabolites of serotonin, and c-jun n-terminal kinase (JNK), which is an apoptosis effector, were significantly decreased in this mRNA preparation (green outline). We also previously found that E2F1 was significantly increased in this mRNA preparation (green outline). (reprinted from [62])
Figure 3
Figure 3
Histograms illustrating the relative expression of SOD1, VEGF and BIRC4 in the dorsal raphe block as determined with qRT-PCR (n=3 animals/treatment). There was a significant difference between treatment groups for each gene (p < 0.05, ANOVA). Post hoc pairwise comparison indicated that SOD1 and VEGF were significantly higher in the E+P group than the OVX control group, and that BIRC4 was significantly higher in the E and E+P groups than in the OVX control groups. These changes in expression confirm the expression as reported by the microarray. (reprinted from [62])
Figure 4
Figure 4
Histograms illustrating the relative expression of TPH2 in the dorsal raphe block compared to laser-captured serotonin neurons (n=3 animals/treatment). There was an enrichment of TPH2 relative to GAPDH in the laser capture pools (top) compared to the dorsal raphe blocks (bottom) illustrated by plotting the data on the same scale. The insert illustrates the relative expression of TPH2 in the dorsal raphe block on a smaller x-axis scale. There was a significant difference between the treatment groups in the laser capture pools (ANOVA p <0.02) and in the dorsal raphe blocks (ANOVA p < 0.01). Asterisks indicate a significant difference from the Ovx control group as determined by posthoc pairwise comparison (SNK p < 0.05). (reprinted from [62])
Figure 5
Figure 5
Diagrammatic illustration of the hormone therapy-induced gene changes related to apoptosis in laser-captured serotonin neurons (2-fold or greater compared to Ovx placebo control, n=2animals/treatment). Genes that exhibited a 2-fold or greater increase are shown in RED and genes that exhibited a 2-fold or greater decrease are shown in BLUE. Other information is shown in black. Arrows indicate downstream drive or activation, whereas t-bars indicate downstream blockade. SOD1 and FGFR2 increased in serotonin neurons in the same fashion as in the dorsal raphe block. In the caspase dependent pathway, RIP1, BID, Apaf1, Diablo and CARD8 were decreased. The expression of procaspase 3 increased but this may not translate to active protein. In the caspase independent pathway, AIF was decreased. There was a marked increase in IκBα, which binds NFκB in the cytoplasm. Other survival related genes that increased include NTRK2, PI3K (85Kd subunit), PKA (catalytic subunit) and calpain. (reprinted from [62])
Figure 6
Figure 6
Histograms illustrating the relative expression of SOD1, calpain (CAPN2), Diablo and cyclin D (CCND1) in laser captured serotonin neurons (n=3 animals/treatment) as determined with qRT-PCR. There was a significant difference between the groups for all 4 genes. There was a significant increase in SOD1 and calpain with E and E+P treatment (posthoc comparison, SNK p < 0.05). There was a significant decrease in cyclin D with E and E+P treatment and a significant decrease in Diablo with E+P treatment (posthoc comparison, SNK p < 0.05). These changes in expression confirm the expression as reported by the microarray. (reprinted from [62])
Figure 7
Figure 7
Diagrammatic illustration of the hormone therapy-induced changes in cell cycle regulatory genes in laser-captured serotonin neurons. Genes that exhibited a 2-fold or greater increase are shown in RED and genes that exhibited a 2-fold or greater decrease are shown in BLUE. Other information is shown in black. Arrows indicate downstream drive or activation, whereas t-bars indicate downstream blockade. There was a 2-fold or greater decrease in gene expression for Cyclins A, B, D1 and E. However, there was a 2-fold increase in gene expression for the checkpoint protein, ATM. Altogether, these changes would prevent serotonin neurons from re-entering the cell cycle which leads to catastrophic apoptosis in terminally differentiated neurons. (reprinted from [62])
Figure 8
Figure 8
Hormone therapy decreases JNK1 expression and activity. (A) Cytoplasmic fraction from representative Ovx control, E and E+P-treated animals were immunoblotted for JNK1 and phospho-JNK1. JNK1 and phospho-JNK1 expression were reduced in E+P-treated animals. Actin was used as a loading control. (B) Histograms illustrating the optical density of JNK1 and phospho-JNK1 as the percentage of Ovx control (n=4/group). There was a significant difference between the groups for both JNK1 and phospho-JNK1 (ANOVA p < 0.05). JNK1 was significantly decreased in E treated animals and in E+P-treated animals, phospho-JNK1 was significantly reduced (posthoc comparison p<0.05). (reprinted from [91])
Figure 9
Figure 9
Hormone therapy does not alter the expression of Bcl-2 family members. (A) Mitochondrial fractions from representative Ovx control, E and E+P treated animals were immunoblotted for Bcl-2, Mcl-1, Bak and Bax. COX I was used as loading control. (B) Cytoplasmic fractions from representative animals of each treatment group were immunoblotted for Bax. Actin was used as loading control. (C) Histograms illustrating the optical density of Bcl-2 family members (Bcl-2, Mcl-1, Bak, and Bax) as the percentage of Ovx control (n=4/group). There was no significant difference between the groups for any of the Bcl-2 family members in either the mitochondrial or cytoplasmic fractions (ANOVA p > 0.1). (reprinted from [91])
Figure 10
Figure 10
Hormone therapy did not affect apoptosome components. (A) Immunoblots showing cytochrome c in mitochondria and cytoplasm from representative Ovx control, E and E+P-treated animals (B) Histograms illustrating the optical density of cytochrome c as the percentage of Ovx control in cytoplasm and mitochondria (n=4/group). There was no significant difference between the groups for either cytoplasmic or mitochondrial cytochrome c expression (ANOVA p > 0.1). (C) Immunoblots showing Apaf1 expression in representative Ovx control, E and E+P treated animals. (D) Histogram illustrating the optical density of Apaf1 as the percentage of Ovx control (n=4/group). There was no significant difference between the groups for Apaf1 (ANOVA p > 0.1). (reprinted from [91])
Figure 11
Figure 11
Effect of hormone therapy on effector caspase-3 and caspase inhibitor. (A) Immunoblot examining pro-caspase 3 and cleaved caspase 3 in representative Ovx control, E and E+P treated animals. (B) Histograms illustrating the optical density of pro-caspase 3 as the percentage of Ovx control (n=4/group). There was a significant difference between the groups for pro-caspase 3 (ANOVA p < 0.05). Pro-caspase 3 was decreased in the E+P-treated animals (posthoc comparison p<0.05). (C) XIAP expression examined by immunoblot in representative Ovx, E and E+P treated animals. Actin was used as loading control. D) Histograms illustrating the optical density of XIAP as the percentage of Ovx control (n=4/group). There was no difference in XIAP with hormone treatment. (reprinted from [91])
Figure 12
Figure 12
Effect of hormone therapy on AIF protein expression and nuclear translocation from the mitochondria. (A) Histogram illustrating the relative expression of AIF in the dorsal raphe block as determined with qRT-PCR (n=3/group). Although the difference was not statistically significant, there was a downward trend in AIF gene expression in E and E+P-treated animals. (B) Immunoblot examining AIF expression in the mitochondria (mAIF) and in the nucleus (nAIF) of representative Ovx control, E and E+P treated animals. There appears to be more AIF in the mitochondrial fraction and less AIF in the nuclear fraction with E+P treatment. (C) Histograms illustrating the optical density of mitochondrial AIF and nuclear AIF as the percentage of Ovx control (n=4/group). There was a significant difference between the groups for nuclear AIF (ANOVA p < 0.05). Nuclear translocation of AIF from mitochondria was significantly decreased in E+P-treated animals (posthoc comparison p<0.05). (reprinted from [91])
Figure 13
Figure 13
Photomicrographs of AIF immunostaining in the midbrain region containing the dorsal and median raphe nuclei. AIF immunostaining was detected only in the large serotonin-like neurons of the raphe nuclei and not in other areas. (A) Low power photomicrograph of the AIF positive neurons in the dorsal raphe nucleus. (B) High power photomicrograph of the AIF positive neurons in the median raphe region, which was not part of the dorsal raphe block used for protein analysis. (C) High power photomicrograph of the AIF positive neurons in the dorsal raphe nucleus. (reprinted from [91])
Figure 14
Figure 14
Optical density analysis of KMO protein on western blots. KMO was measured in a crude membrane pellet after homogenization of the dorsal raphe block from ovariectomized monkeys treated with placebo (Ovx, n=6), or treated with estradiol (E, n=4), or treated with estradiol plus progesterone (EP, n=4). Representative bands are illustrated. Top histogram: Optical density of KMO signal bands on western blots. There was a significant difference between the groups (ANOVA, p = 0.01). Posthoc analysis indicated that both E-treated and E+P-treated groups were significantly different from the Ovx group (Student Newman Keul’s p < 0.05). Bottom histogram: Ratio of the KMO optical density to the actin optical density in the same animals as above. There was a significant difference between the groups (ANOVA, p=0.04). Posthoc analysis indicated there was a significant difference between the EP-treated group and the Ovx group (Student Newman Keul’s p < 0.05). (presented at the Annual Meeting of the Society for Neuroscience, Washington, DC, 2008; Henderson JA and Bethea CL, poster 279.19)
Figure 15
Figure 15
Photomicrographs of KMO immunostaining in the dorsal raphe nucleus. KMO is widespread in neurons and glia, but the serotonin neurons appear to have higher concentrations that neighboring cells. Of the KMO-positive cells in the dorsal raphe, some cells along the dorsal edges were extremely darkly stained, and other cells in the body of the nucleus were lighter. A. Photomicrograph of cells from the body of the dorsal raphe that are stained for KMO. B. Photomicrograph of cells along the dorsal edge of the dorsal raphe that are stained for KMO. C. Higher magnification photomicrograph of cells from the body of the dorsal raphe that are stained for KMO. The densely labeled mitochondria that contain KMO are represented by the punctuate staining pattern. D. Higher magnification photomicrograph of cells along the dorsal edge of the dorsal raphe that are stained for KMO. The densely labeled mitochondria that contain KMO are represented by the punctate staining pattern. E. Lower power montage of the entire dorsal raphe showing the organization of the cells in the body (top) and the intensely labeled cells along the dorsal edge. F. Very high magnification photomicrograph of cells from the body of the dorsal raphe showing the punctate mitochondrial-staining pattern consistent with the localization of KMO. (presented at the Annual Meeting of the Society for Neuroscience, Washington, DC, 2008; Henderson JA and Bethea CL, poster 279.19)
Figure 16
Figure 16
Mean of the KMO positive pixel area at each of 7 levels of the dorsal raphe nucleus in ovariectomized monkeys treated with placebo (Ovx), E, P or E+P (=5/treatment). Except for level 7, there was an apparent decrease in KMO positive pixels with E and EP treatment. After average of the levels, there was a significant difference between the groups (1 way ANOVA, p=0.003). Posthoc analysis indicated that E- and EP-treated groups were significantly different from the Ovx-placebo and P-treated groups (p < 0.05). (unpublished)
Figure 17
Figure 17
Overall mean±SEM of KMO positive pixel area across the 7 levels for each group. Two-way ANOVA was performed in which groups administered E (E and EP) were compared to groups without E (OVX, P). There was a significant difference between the treatment groups (p<0.001) and between the levels (p=0.009) but there was no interaction between treatment and level. (presented at the Annual Meeting of the Society for Neuroscience, Washington, DC, 2008; Henderson JA and Bethea CL, poster 279.19)
Figure 18
Figure 18
Illustration of DNA fragmentation and TUNEL staining in the post-weaning rat- mammary gland and in the dorsal raphe nucleus of rhesus monkeys. There are 2 staining patterns observed which have been previously reported in other models and referred to as type I and type II. Complete dark staining of the nucleus, type I, and peripheral staining in the perinuclear area, type II, may reflect different stages of the DNA fragmentation process that starts in the periphery and moves inward. Alternatively, the perinuclear, type II staining could indicate DNA leakage from the nucleus. Double-head arrows indicate Type 1 staining and single-head arrows indicate Type 2 staining. Panel A - TUNEL staining of the mammary gland without counterstain. Panel B - TUNEL staining of the mammary gland with methyl green counterstain. Panel C - TUNEL staining in the dorsal raphe nucleus without counterstain. Panel D – TUNEL staining of the dorsal raphe nucleus with methyl green counterstain. Panel E- TUNEL staining of the dorsal raphe nucleus after exposure of the section to DNAse for 10 minutes prior to TUNEL assay. There is an increase in the number of cells exhibiting different degrees of DNA fragmentation. Panel F – Negative control section of the dorsal raphe generated by omission of the Tdt reagent in the TUNEL assay. There was no apparent DNA fragmentation detected. (reprinted from [118])
Figure 19
Figure 19
Comparison of TUNEL staining at level 5 of the dorsal raphe nucleus from a representative animal in each treatment group: The animals were ovariectomized and treated with placebo (OVX), estradiol (E), progesterone (P) or estradiol plus progesterone (EP) for 28 days. Arrows indicate TUNEL positive cells. (reprinted from [118])
Figure 20
Figure 20
Histograms illustrating the results of stereological analysis of the number of TUNEL-positive neurons in the dorsal raphe nucleus of rhesus macaques treated for 28 days with placebo (OVX), estradiol (E), progesterone (P) or estradiol plus progesterone (EP). TUNEL stained neurons were counted on the montage within a defined area (μ2). (A) Average (±SEM) of the total number of TUNEL-positive cells in 8 levels of the dorsal raphe nucleus in each treatment group (n=5 animals/group). There was a significant decrease in the total number of TUNEL positive neurons in the P and EP- treated groups compared with the OVX group (p=0.04 for P versus Ovx and p=0.04 for EP versus Ovx, Mann-Whitney nonparametric test). (B) Average (±SEM) of the TUNEL-positive neurons per cubic millimeter (mm3) of eight levels of the dorsal raphe nucleus in each treatment group (n=5 animals/group). There was a significant decrease in TUNEL-positive cells/mm3 in the E+P- treated group (p=0.04, Mann-Whitney nonparametric test), while the P group was nearly significantly different (p=0.1, Mann-Whitney nonparametric test). (C) Comparison of the total volume of the area measured in each treatment group showed no difference. (reprinted from [118])
Figure 21
Figure 21
Illustration of colocalization of TUNEL staining and tryptophan hydroxylase (TPH) in neurons of the dorsal raphe nucleus. Photomicrographs are from the dorsal raphe nucleus of an OVX monkey following double-immunohistochemistry for TPH (blue, cytoplasmic) and TUNEL (brown, nuclear, perinuclear). Single arrows indicate double-labeled neurons with type I TUNEL staining. Double-headed arrows indicate double-labeled neurons with type II TUNEL staining. Green arrows indicate neurons that are stained only for TPH. Red arrows indicate TUNEL-positive neurons that are in advanced stages of disintegration. A. Photomicrograph of a region of the dorsal raphe containing 2, or possibly 3, serotonin neurons with no TUNEL staining (green arrows and adjacent cell). One cell is present with TUNEL staining in the perinuclear area and TPH staining in the cytoplasm (double arrow). Other TUNEL positive cells are apparent that are either not serotonergic, or degradation has proceeded to the point that TPH is no longer present. The scale bar also applies to panels B, C and the upper left picture in panel E. B. Photomicrograph of a region of the dorsal raphe containing TUNEL-positive cells at different stages of disintegration. The double-headed arrow highlights a TUNEL-positive cell with TPH-positive cytoplasm remaining. The red arrow highlights a TUNEL-positive cell in an advanced stage of degradation with little TPH-positive cytoplasm remaining. Other TUNEL positive cells are evident that are either not serotonergic, or degradation has proceeded to the point that TPH is no longer present. C. Photomicrograph of a region of the dorsal raphe from an ovariectomized macaque treated with placebo that exhibited very high numbers of TUNEL positive cells in the stereological analysis. There are few remnants of TPH-positive cytoplasm remaining in this cluster of dying cells. D. Photomicrograph of two neurons double-labeled for TUNEL and TPH. The left neuron exhibits type I TUNEL staining (single arrow), which is predominantly nuclear, whereas the right neuron exhibits type II staining (double arrow) in which the DNA fragmentation is perinuclear. E. Multi-panel with photomicrographs of TPH-positive neurons with different degrees of DNA fragmentation, and one TPH-positive neuron with no apparent TUNEL staining (bottom right, green arrow). Single arrows indicate serotonin neurons with type I TUNEL staining and double-headed arrows indicate serotonin neurons with type II TUNEL staining. The red arrows indicate serotonin neurons with TUNEL staining that is in an advanced stage of degradation as indicated by the sparse TPH staining. F. Photomicrograph of a region of the dorsal raphe that contains a neuron that is double labeled for TUNEL and TPH (double arrow), a serotonin neuron with no apparent TUNEL stain (green arrow), and a TUNEL–positive neuron in an advanced stage of degradation (red arrow). G. Photomicrograph of the periaquaductal gray region of the same section as panel C. There was no apparent TUNEL staining in this region. TUNEL staining was absent or rare in other adjacent neural structures of the midbrain suggesting that serotonin neurons are particularly vulnerable to steroid withdrawal. (reprinted from [118]).

References

    1. Bethea CL. Colocalization of progestin receptors with serotonin in raphe neurons of macaque. Neuroendocrinology. 1993;57:1–6. - PubMed
    1. Gundlah C, Lu NZ, Mirkes SJ, Bethea CL. Estrogen receptor beta (ERβ) mRNA and protein in serotonin neurons of macaques. Molecular Brain Research. 2001;91:14–22. - PubMed
    1. Sanchez RL, Reddy AP, Centeno ML, Henderson JA, Bethea CL. A second tryptophan hydroxylase isoform, TPH-2 mRNA, is increased by ovarian steroids in the raphe region of macaques. Brain Res Mol Brain Res. 2005;135:194–203. - PubMed
    1. Bethea CL, Lu NZ, Gundlah C, Streicher JM. Diverse actions of ovarian steroids in the serotonin neural system. Frontiers in Neuroendocrinology. 2002;23:41–100. - PubMed
    1. Lu NZ, Bethea CL. Ovarian steroid regulation of 5HT1A receptor binding and G protein activation in female monkeys. Neuropsychopharmacology. 2002;27:12–24. - PubMed

Publication types

MeSH terms