

Comparison of LDL cholesterol concentrations by Friedewald calculation and direct measurement in relation to cardiovascular events in 27,331 women
- PMID: 19395440
- PMCID: PMC2692888
- DOI: 10.1373/clinchem.2008.117929
Comparison of LDL cholesterol concentrations by Friedewald calculation and direct measurement in relation to cardiovascular events in 27,331 women
Abstract
Background: National Cholesterol Education Program (NCEP) guidelines recommend development of direct assays for LDL cholesterol (LDL-C) measurement, but it is unclear how these assays compare with Friedewald calculation in predicting cardiovascular disease (CVD).
Methods: In a study of 27 331 healthy women with triglycerides <or=4.52 mmol/L (<or=400 mg/dL), baseline fasting Friedewald LDL-C was compared with fasting and nonfasting direct homogenous measurement for incident CVD during an 11-year period.
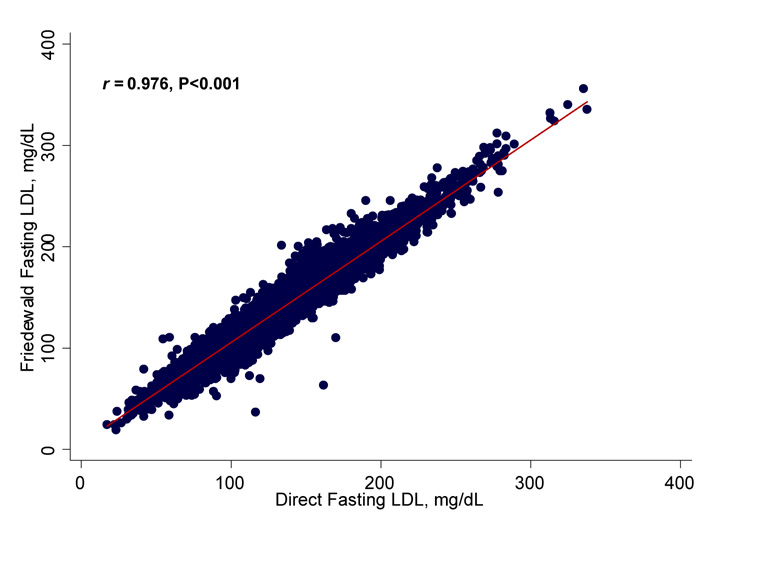
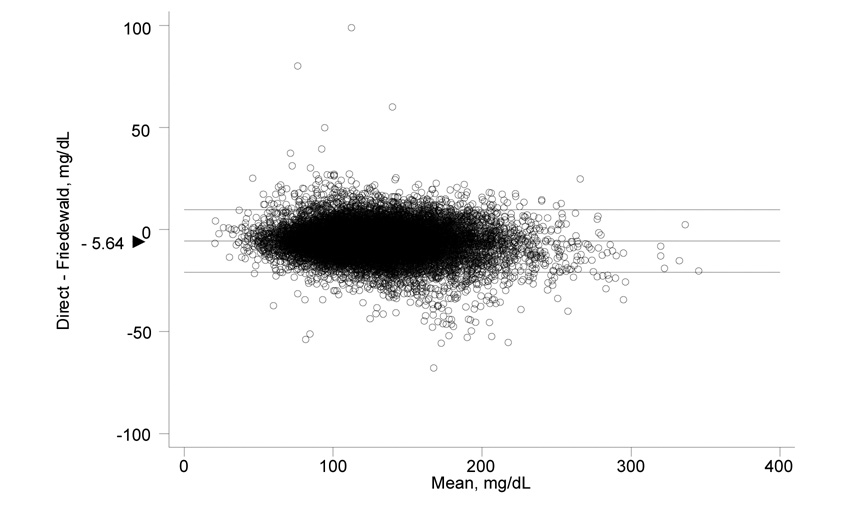
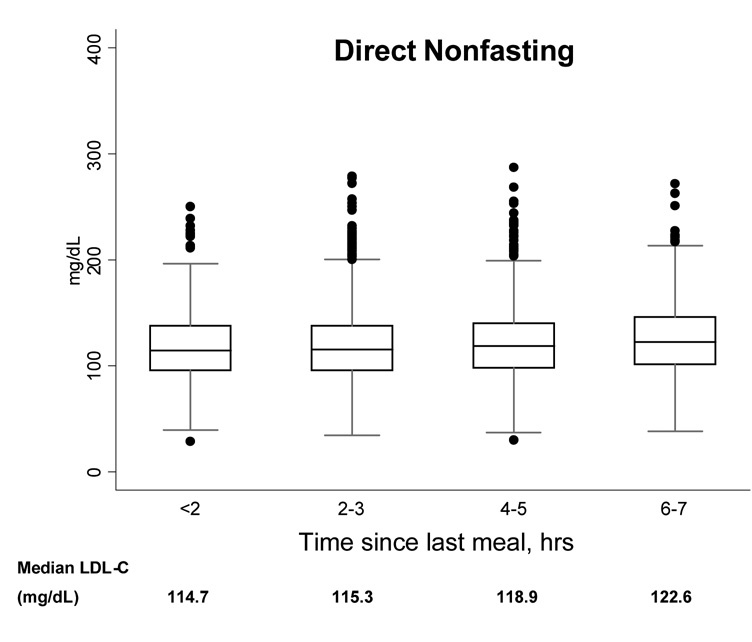
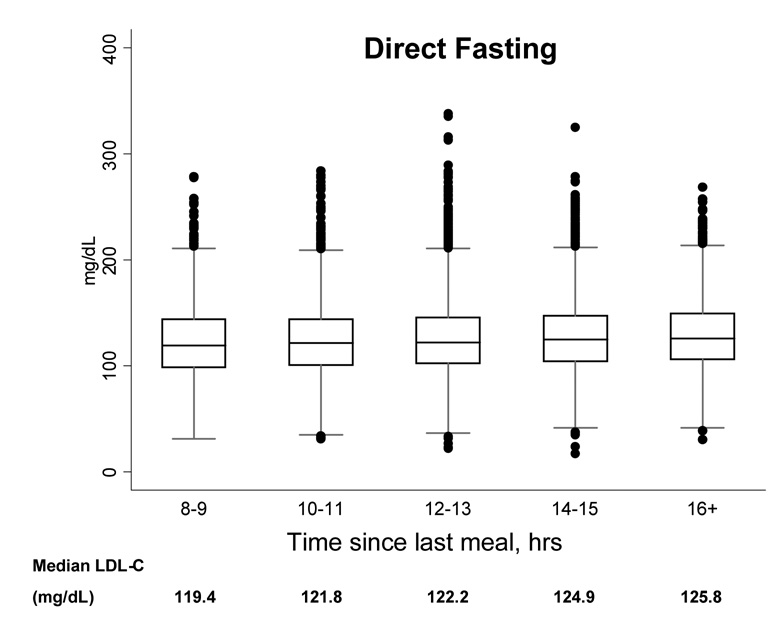
Results: Fasting LDL-C measurements obtained by the 2 methods were highly correlated (r = 0.976, P < 0.001). Compared with fasting Friedewald LDL-C, mean fasting direct LDL-C was 0.15 mmol/L (5.6 mg/dL) lower and nonfasting direct LDL-C 0.30 mmol/L (11.5 mg/dL) lower, both P < 0.0001. The adjusted hazard ratio per 1-SD increment was 1.23 [95% CI 1.15-1.32; 1-SD 0.88 mmol/L (34.1 mg/dL)] for fasting direct LDL-C and 1.22 [95% CI 1.14-1.30; 1-SD 0.90 mmol/L (34.9 mg/dL)] for fasting Friedewald. Nonfasting LDL-C was not associated with CVD by either method. Fasting LDL-C measurements fell into the same NCEP risk category with either method for 79.3% of participants, whereas they differed by 1 NCEP category for 20.7% of participants, with most classified into a lower-risk category by direct LDL-C.
Conclusions: The association of LDL-C with CVD by the 2 methods was nearly identical in fasting samples. However, the lower direct LDL-C concentrations may misclassify many individuals into a lower NCEP category. Moreover, the lack of association of nonfasting direct LDL-C with CVD raises questions regarding the clinical utility of a direct assay for LDL-C in nonfasting blood samples.
Trial registration: ClinicalTrials.gov NCT00000479.
Conflict of interest statement
The authors report no conflicts.
Figures
Comment in
-
Fasting and nonfasting LDL cholesterol: to measure or calculate?Clin Chem. 2009 May;55(5):845-7. doi: 10.1373/clinchem.2008.123083. Epub 2009 Mar 12. Clin Chem. 2009. PMID: 19282353 No abstract available.
References
-
- Executive Summary of The Third Report of The National Cholesterol Education Program (NCEP) Expert Panel on Detection, Evaluation, And Treatment of High Blood Cholesterol In Adults (Adult Treatment Panel III) JAMA. 2001;285:2486–2497. - PubMed
-
- Friedewald WT, Levy RI, Fredrickson DS. Estimation of the concentration of low-density lipoprotein cholesterol in plasma, without use of the preparative ultracentrifuge. Clin Chem. 1972;18:499–502. - PubMed
-
- Bachorik PS, Ross JW. National Cholesterol Education Program recommendations for measurement of low-density lipoprotein cholesterol: executive summary. The National Cholesterol Education Program Working Group on Lipoprotein Measurement. Clin Chem. 1995;41:1414–1420. - PubMed
-
- Recommendations on lipoprotein measurement from the working group on lipoprotein measurement. Washington: US Governement Printing Office; 1995. pp. 1–194. National Institutes of Health Publication No. 95-3044.
-
- Nauck M, Warnick GR, Rifai N. Methods for measurement of LDL-cholesterol: a critical assessment of direct measurement by homogeneous assays versus calculation. Clin Chem. 2002;48:236–254. - PubMed
Publication types
MeSH terms
Substances
Associated data
Grants and funding
LinkOut - more resources
Full Text Sources
Other Literature Sources
Medical
