Comparative Study
. 2009 Jun 15;169(12):1517-24.
doi: 10.1093/aje/kwp072. Epub 2009 Apr 24.

Optimal dosing and dynamic distribution of vaccines in an influenza pandemic

Affiliations
Comparative Study

Optimal dosing and dynamic distribution of vaccines in an influenza pandemic

James Wood et al. Am J Epidemiol. .

Abstract

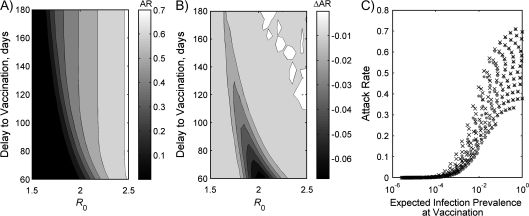
Limited production capacity and delays inherent in vaccine development are major hurdles to the widespread use of vaccines to mitigate the effects of a new influenza pandemic. Antigen-sparing vaccines have the most potential to increase population coverage but may be less efficacious. The authors explored this trade-off by applying simple models of influenza transmission and dose response to recent clinical trial data. In this paper, these data are used to illustrate an approach to comparing vaccines on the basis of antigen supply and inferred efficacy. The effects of delays in matched vaccine availability and seroconversion on epidemic size during pandemic phase 6 were also studied. The authors infer from trial data that population benefits stem from the use of low-antigen vaccines. Delayed availability of a matched vaccine could be partially alleviated by using a 1-dose vaccination program with increased coverage and reduced time to full protection. Although less immunogenic, an overall attack rate of up to 6% lower than a 2-dose program could be achieved. However, if prevalence at vaccination is above 1%, effectiveness is much reduced, emphasizing the need for other control measures.


Figures

Figure 1.
Figure 1.
A: Schematic of dose response and interpretation of the linear model fits, indicating valid dose—domain for linear models; B: fits to estimated susceptibilities for Sinovac Biotech Co., Ltd. (Bejing, China) (12) (squares) and Sanofi Pasteur (Lyon, France) (9) (circles) adjuvanted vaccines, as well as estimated cross-protective (triangles) and matched (asterisks) values for GlaxoSmithKline Biologicals (Rixensart, Belgium) 1- and 2-dose (3.75 μg/dose) adjuvanted vaccines; C, D: effective reproduction number, R, for a given dose-response pair, with a fixed stockpile giving 20% coverage at the maximum tested dose; E, F: attack rate (AR) for a given dose-response pair, again with 20% coverage at the maximum tested dose. In panels C and E, ei = 1; in panels D and F, ei = es; R0 = 2 in panels C–F. Squares and circles in panels C–F correspond to estimated relative susceptibilities for Sanofi and Sinovac vaccines, respectively, and appear at x values given by the tested dose divided by the maximum tested dose in the trial (30 μg and 10 μg, respectively, for the Sanofi and Sinovac trials). ei, mean relative infectivity; es, mean relative susceptibility.
Figure 2.
Figure 2.
Attack rate (AR) for a given dose-response pair with 20% coverage at the maximum tested dose, with R0 = 2 and vaccination delayed until the current attack rate is 0.01% (panels A and B) and 1% (panels C and D). In panels A and C, ei = 1; in panels B and D, ei = es. Squares and circles correspond to estimated relative susceptibilities for the Sanofi Pasteur (Lyon, France) (9) and Sinovac Biotech Co., Ltd. (Bejing, China) (12) vaccines, respectively, and appear at x-axis values given by the tested dose divided by the maximum tested dose in the trial (30 μg and 10 μg, respectively, for the Sanofi and Sinovac trials). ei, mean relative infectivity; es, mean relative susceptibility; R, effective reproduction number.
Figure 3.
Figure 3.
Contours representing the overall serologic attack rate (AR) in the 1-dose program (panel A) and the difference in attack rate (ΔAR) after an epidemic between the 1- and 2-dose programs (panel B) as a function of delay to vaccination and R0. Antigen supply is constrained, with 1-dose coverage = 100% and 2-dose coverage = 50%. In each panel, ei = 1. The attack rates vary according to the gray-scale bar (right of panel). Negative values in panel B are due to a lower attack rate with the 1-dose program. In panel C, the attack rate is graphed in terms of the expected prevalence of infection when the vaccine is delivered. Attack rates are represented by dots for the 1-dose program and by crosses for the 2-dose program. ei, mean relative infectivity; R, effective reproduction number.

References

    1. Fedson DS. Pandemic influenza and the global vaccine supply. Clin Infect Dis. 2003;36(12):1552–1561. - PubMed
    1. Fedson D. Preparing for pandemic vaccination: an international policy agenda for vaccine development. J Public Health Policy. 2005;26(1):4–29. - PMC - PubMed
    1. Daems R, Del Giudice G, Rappuoli R. Anticipating crisis: towards a pandemic flu vaccination strategy through alignment of public health and industrial policy. Vaccine. 2005;23(50):5732–5742. - PubMed
    1. Caley P, Becker NG, Philp DJ. The waiting time for inter-country spread of pandemic influenza [electronic article] PLoS ONE. 2007;2(1):e143. - PMC - PubMed
    1. Colizza V, Barrat A, Barthelemy M, et al. Modeling the worldwide spread of pandemic influenza: baseline case and containment interventions [electronic article] PLoS Med. 2007;4(1):e13. - PMC - PubMed

Publication types

MeSH terms

Substances