Review
. 2009 May;48(5):465-470.
doi: 10.1097/CHI.0b013e31819f2715.

Anatomical brain magnetic resonance imaging of typically developing children and adolescents

Affiliations
Review

Anatomical brain magnetic resonance imaging of typically developing children and adolescents

Andrew J Gerber et al. J Am Acad Child Adolesc Psychiatry. 2009 May.
No abstract available


Figures

Fig. 1
Fig. 1
Mean volume by age in years for male subjects (n = 475 scans) and female subjects (n = 354 scans). Middle lines in each set of three lines represent mean values, and upper and lower lines represent upper and lower 95% confidence intervals, respectively. All curves differed significantly in height and shape. Figure adapted from Lenroot et al., 2007.
Fig. 2
Fig. 2
Right lateral and top views of the dynamic sequence of gray matter maturation over the cortical surface. The side bar shows a color representation in units of gray matter volume. (From Gogtay et al.8)
Fig. 3
Fig. 3
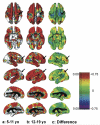
Age-related changes in heritability for younger and older children. Variance component estimates are calculated using the AE model, because the shared environment component did not significantly affect results. Estimates of variance components were computed separately for younger children (aged 5–11 years) and for older children and adolescents (aged 12–19 years). Columns a and b show areas that are significantly heritable for younger (a) and older (b) age groups. Column c is a map of differences in heritability, created by subtracting the values for the younger group from those of the older group. Arrows indicate regions in which heritability changes between age groups. Numbers to the left of the scale bar indicate degree of statistical significance. Numbers to the right of the scale bar indicate the magnitude of the difference in heritability: light green, yellow, and red regions indicate heritability increasing with age; dark green, blue, and purple regions indicate decreasing heritability. A false discovery rate threshold of q = 0.05 was applied to significance maps. (From Lenroot et al.15)

References

    1. Lenroot RK, Gogtay N, Greenstein DK, et al. Sexual dimorphism of brain developmental trajectories during childhood and adolescence. Neuroimage. 2007;36:1065–1073. - PMC - PubMed
    1. Mackie S, Shaw P, Lenroot R, et al. Cerebellar development and clinical outcome in attention deficit hyperactivity disorder. Am J Psychiatry. 2007;164:647–655. - PubMed
    1. Lange N, Giedd JN, Castellanos FX, Vaituzis AC, Rapoport JL. Variability of human brain structure size: ages 4 to 20. Psychiatry Res. 1997;74:1–12. - PubMed
    1. Sowell ER, Thompson PM, Leonard CM, Welcome SE, Kan E, Toga AW. Longitudinal mapping of cortical thickness and brain growth in normal children. J Neurosci. 2004;24:8223–8231. - PMC - PubMed
    1. Caviness VSJ, Kennedy DN, Richelme C, Rademacher J, Filipek PA. The human brain age 7–11 years: a volumetric analysis based on magnetic resonance images. Cereb Cortex. 1996;6:726–736. - PubMed

Publication types