. 2009 Jul;48(7):569-82.
doi: 10.1002/gcc.20666.

Decreased expression of miR-125b and miR-100 in oral cancer cells contributes to malignancy

Affiliations

Decreased expression of miR-125b and miR-100 in oral cancer cells contributes to malignancy

Brian J Henson et al. Genes Chromosomes Cancer. 2009 Jul.

Abstract

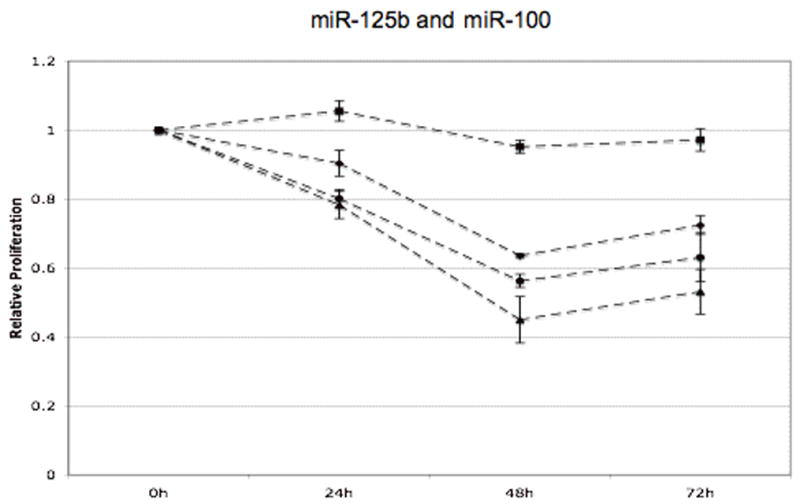
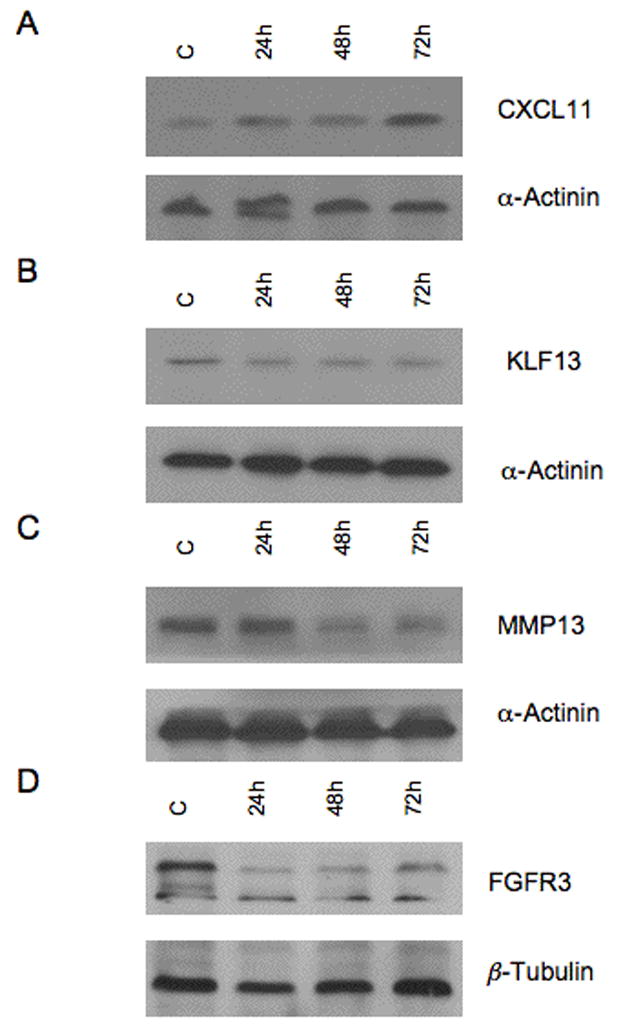
Altered microRNA (miRNA) expression profiles have been observed in numerous malignancies, including oral squamous cell carcinoma (OSCC). However, their role in disease is not entirely clear. Several genetic aberrations are characteristic of OSCC, with amplification of chromosomal band 11q13 and loss of distal 11q being among the most prevalent. It is not known if the expression levels of miRNAs in these regions are altered or whether they play a role in disease. We hypothesize that the expression of miRNAs mapping to 11q are altered in OSCC because of loss or amplification of chromosomal material, and that this contributes to the development and progression of OSCC. We found that miR-125b and miR-100 are down-regulated in OSCC tumor and cell lines, and that transfecting cells with exogenous miR-125b and miR-100 significantly reduced cell proliferation and modified the expression of target and nontarget genes, including some that are overexpressed in radioresistant OSCC cells. In conclusion, the down-regulation of miR-125b and miR-100 in OSCC appears to play an important role in the development and/or progression of disease and may contribute to the loss of sensitivity to ionizing radiation.


Figures

Figure 1
Figure 1
An ideogram of chromosome 11 with the locations of the 11q13 amplicon core, FRA11F fragile site, and the miRNAs on 11q noted.
Figure 2
Figure 2
RT-PCR results of (A) miR-125b and (B) miR-100 in OSCC cell lines, OSCC tumors, and NHOK controls, with standard error indicated. NHOK (composed of five independent samples) is represented by a black bar, OSCC tumors are represented by white bars, and OSCC cell lines are represented by black bars with white hatch marks.
Figure 2
Figure 2
RT-PCR results of (A) miR-125b and (B) miR-100 in OSCC cell lines, OSCC tumors, and NHOK controls, with standard error indicated. NHOK (composed of five independent samples) is represented by a black bar, OSCC tumors are represented by white bars, and OSCC cell lines are represented by black bars with white hatch marks.
Figure 3
Figure 3
Results of MTT assays of cells transfected with (A) miR-125b and (B) miR-100, and miR-125b and miR-100), with standard error indicated. Cells transfected with 50 nm are represented by diamonds (◆), 100 nm by circles (●),150 nm by triangles (▲), and the negative control by squares (■). All experimental groups and the negative control are normalized to the mock-transfection control in all three graphs.
Figure 3
Figure 3
Results of MTT assays of cells transfected with (A) miR-125b and (B) miR-100, and miR-125b and miR-100), with standard error indicated. Cells transfected with 50 nm are represented by diamonds (◆), 100 nm by circles (●),150 nm by triangles (▲), and the negative control by squares (■). All experimental groups and the negative control are normalized to the mock-transfection control in all three graphs.
Figure 4
Figure 4
Comparison of microarray and RT-PCR results for cells transfected with (A) miR-125b and (B) miR-100, with standard error indicated. Fold change values determined from microarray data are represented by black bars and the fold change values determined from RT-PCR data are represented by white bars.
Figure 4
Figure 4
Comparison of microarray and RT-PCR results for cells transfected with (A) miR-125b and (B) miR-100, with standard error indicated. Fold change values determined from microarray data are represented by black bars and the fold change values determined from RT-PCR data are represented by white bars.
Figure 5
Figure 5
Western blot confirmation of microarray results. Cells were transfected with 100 nm miR-125b and examined for changes in (A) CXCL11 and (B) KLF13 protein levels at 24, 48, and 72 hours after transfection. Cells were transfected with 100 nm miR-100 and examined for changes in (C) MMP13 and (D) FGFR3 at 24, 48, and 72 hours after transfection. Lanes are labeled C for the pooled negative control.

References

    1. Akervall J, Kurnit DM, Adams M, Zhu SB, Fisher SG, Bradford CR, Carey TE. Overexpression of cyclin D1 correlates with sensitivity to cisplatin in squamous cell carcinoma cell lines of the head and neck. Acta Oto-Laryngol. 2004;124:851–857. - PubMed
    1. Bagga S, Bracht J, Hunter S, Massirer K, Holtz J, Eachus R, Pasquinelli AE. Regulation by let-7 and lin-4 miRNAs results in target mRNA degradation. Cell. 2005;122:553–563. - PubMed
    1. Balestrieri ML, Balestrieri A, Mancini FP, Napoli C. Understanding the immunoangiostatic CXC chemokine network. Cardiovasc Res. 2008;78:250–256. - PubMed
    1. Benjamini Y, Hochberg Y. Controlling the false discovery rate- a practical and powerful approach to multiple testing. J Roy Stat Soc B. 1995;57:289–300.
    1. Berencsi K, Meropol NJ, Hoffman JP, Sigurdson E, Giles L, Rani P, Somasundaram R, Zhang TQ, Kalabis J, Caputo L, Furth E, Swoboda R, Marincola F, Herlyn D. Colon carcinoma cells induce CXCL11-dependent migration of CXCR3-expressing cytotoxic T lymphocytes in organotypic culture. Cancer Immunol Immun. 2007;56:359–370. - PMC - PubMed

Publication types

MeSH terms