

N-methyl-D-aspartate-stimulated ERK1/2 signaling and the transcriptional up-regulation of plasticity-related genes are developmentally regulated following in vitro neuronal maturation
- PMID: 19396876
- PMCID: PMC2857719
- DOI: 10.1002/jnr.22103
N-methyl-D-aspartate-stimulated ERK1/2 signaling and the transcriptional up-regulation of plasticity-related genes are developmentally regulated following in vitro neuronal maturation
Abstract
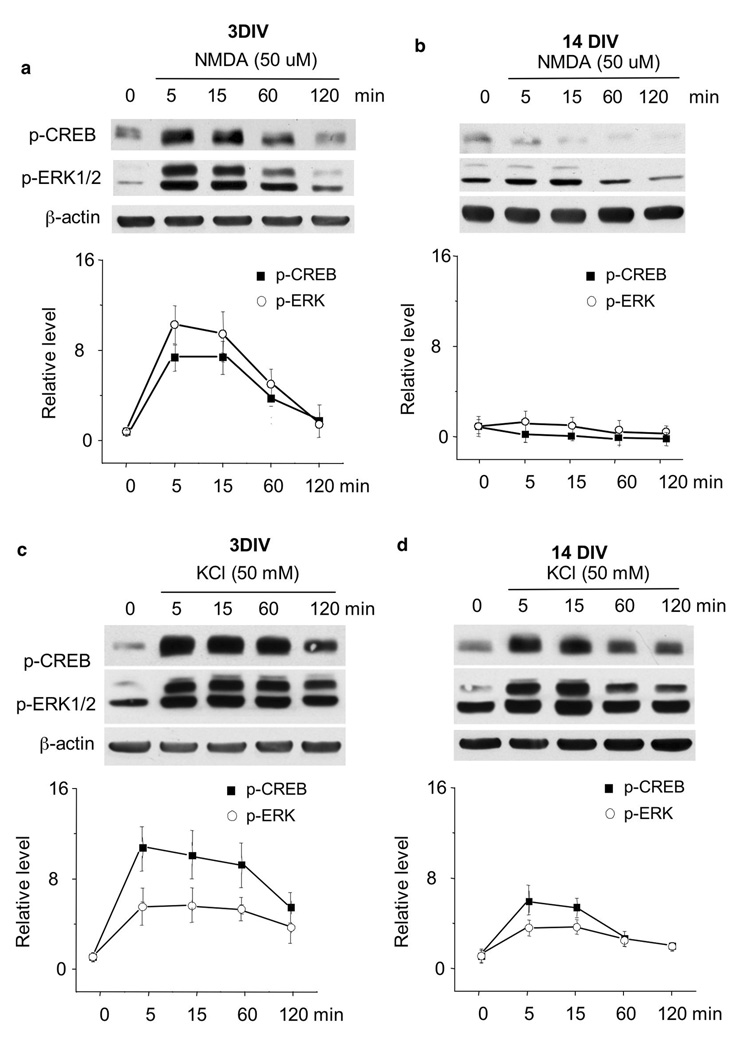
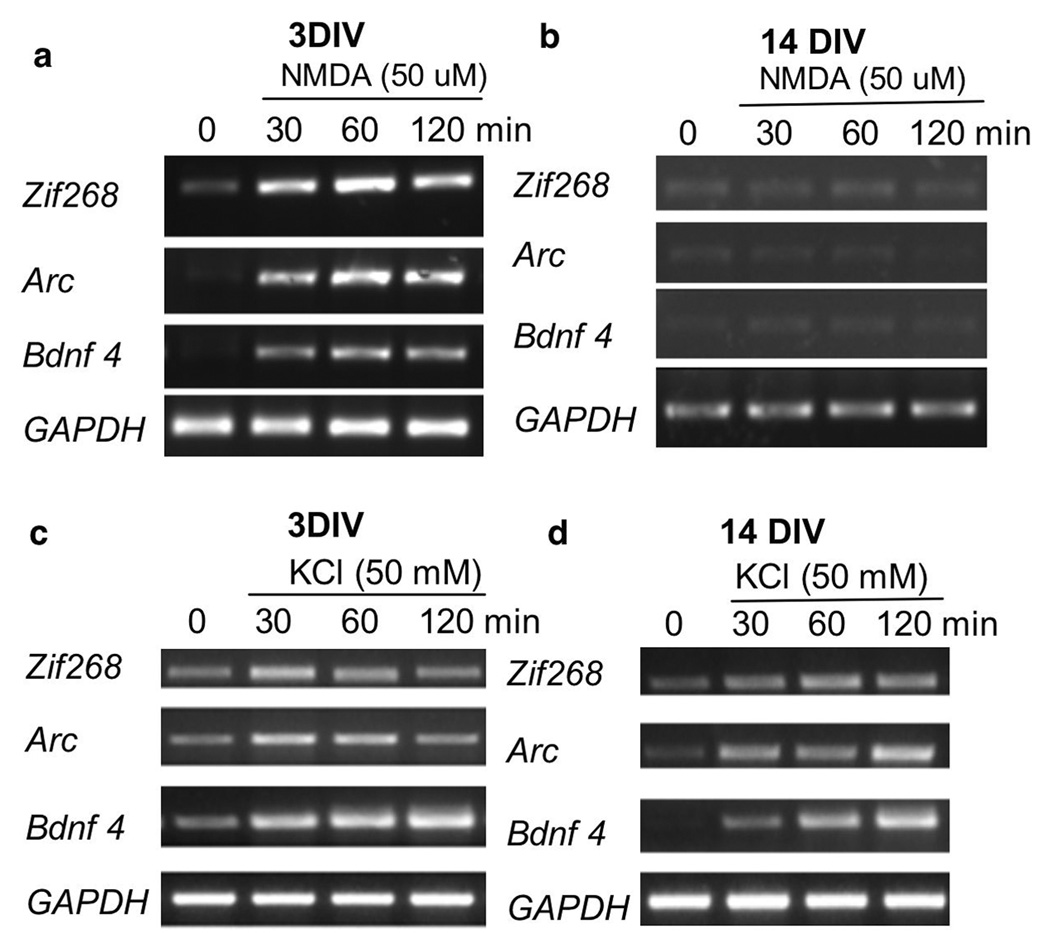
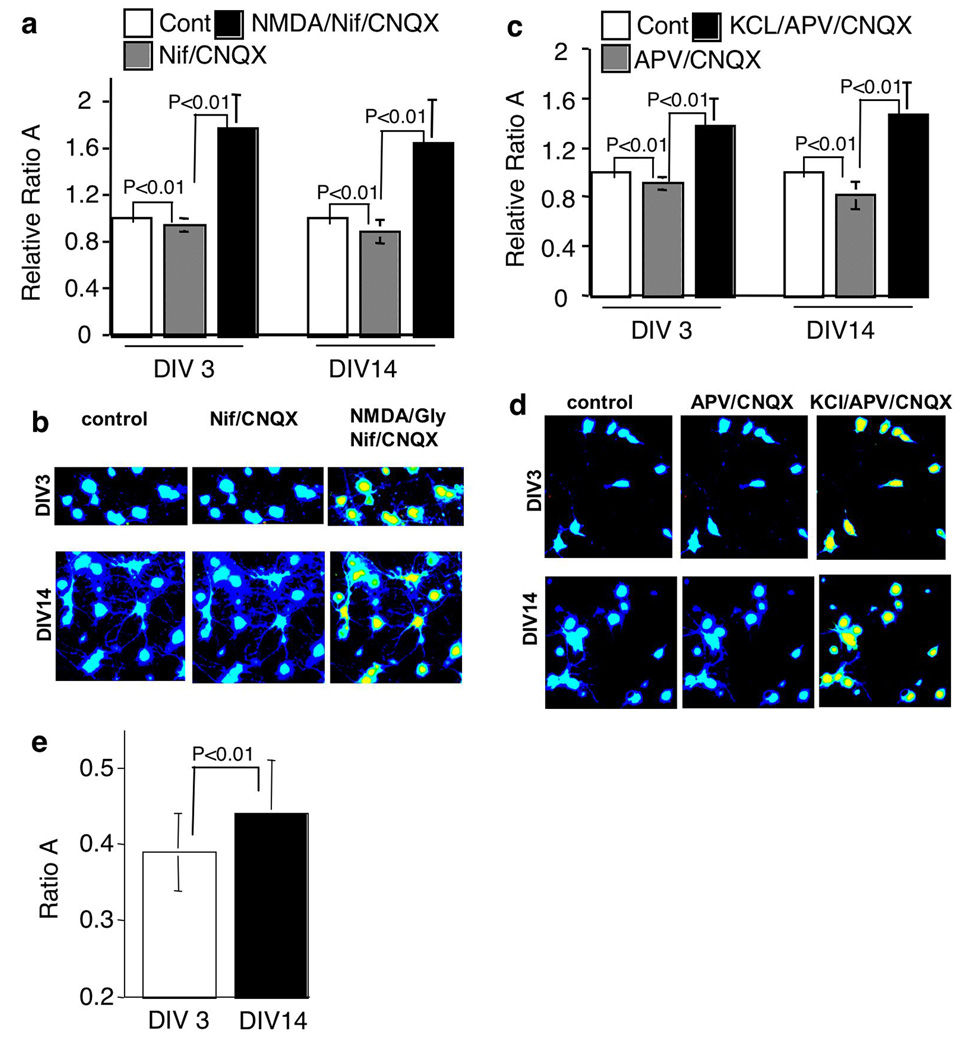
The general features of neuroplasticity are developmentally regulated. Although it has been hypothesized that the loss of plasticity in mature neurons may be due to synaptic saturation and functional reduction of N-methyl-D-aspartate receptors (NMDAR), the molecular mechanisms remain largely unknown. We examined the effects of NMDAR activation and KCl-mediated membrane depolarization on ERK1/2 signaling following in vitro maturation of cultured cortical neurons. Although NMDA stimulated a robust increase in intracellular calcium at both DIV (day in vitro) 3 and 14, the activation of ERK1/2 and cAMP responsive element-binding protein (CREB) was impaired at DIV 14. Specifically, the phosphorylation of ERK1/2 was stimulated by both NMDA and KCl at DIV 3. However, at DIV 14, NMDA- but not KCl-stimulated ERK1/2 and CREB phosphorylation was significantly diminished. Consistently, the NMDA-induced transcription of ERK/CREB-regulated genes Bdnf exon 4, Arc, and zif268 was significantly attenuated at DIV 14. Moreover, in comparison with 3 DIV neurons, the phosphorylated-ERK1/2 in 14 DIV neurons displayed a tremendous increase following maturation and was more susceptible to dephosphorylation. Blocking calcium channels by nifedipine or NMDAR by APV caused a more dramatic ERK dephosphorylation in 14 DIV neurons. We further demonstrate that the loss of plasticity-related signaling is unrelated to NMDA-induced cell death of the 14 DIV neurons. Taken together, these results suggest that the attenuation of certain aspects of neuroplasticity following maturation may be due to the reduction of NMDAR-mediated gene transcription and a saturation of ERK1/2 activity.
Figures


Similar articles
-
Developmentally regulated NMDA receptor-dependent dephosphorylation of cAMP response element-binding protein (CREB) in hippocampal neurons.J Neurosci. 2000 May 15;20(10):3529-36. doi: 10.1523/JNEUROSCI.20-10-03529.2000. J Neurosci. 2000. PMID: 10804193 Free PMC article.
-
Switching of N-methyl-D-aspartate (NMDA) receptor-favorite intracellular signal pathways from ERK1/2 protein to p38 mitogen-activated protein kinase leads to developmental changes in NMDA neurotoxicity.J Biol Chem. 2011 Jun 10;286(23):20175-93. doi: 10.1074/jbc.M110.188854. Epub 2011 Apr 7. J Biol Chem. 2011. PMID: 21474451 Free PMC article.
-
Coupling of extrasynaptic NMDA receptors to a CREB shut-off pathway is developmentally regulated.Biochim Biophys Acta. 2002 Nov 4;1600(1-2):148-53. doi: 10.1016/s1570-9639(02)00455-7. Biochim Biophys Acta. 2002. PMID: 12445470
-
Signaling mechanisms linking neuronal activity to gene expression and plasticity of the nervous system.Annu Rev Neurosci. 2008;31:563-90. doi: 10.1146/annurev.neuro.31.060407.125631. Annu Rev Neurosci. 2008. PMID: 18558867 Free PMC article. Review.
-
Communication between the synapse and the nucleus in neuronal development, plasticity, and disease.Annu Rev Cell Dev Biol. 2008;24:183-209. doi: 10.1146/annurev.cellbio.24.110707.175235. Annu Rev Cell Dev Biol. 2008. PMID: 18616423 Free PMC article. Review.
Cited by
-
Regulation of brain-derived neurotrophic factor exon IV transcription through calcium responsive elements in cortical neurons.PLoS One. 2011;6(12):e28441. doi: 10.1371/journal.pone.0028441. Epub 2011 Dec 9. PLoS One. 2011. PMID: 22174809 Free PMC article.
-
AP-1 controls the p11-dependent antidepressant response.Mol Psychiatry. 2020 Jul;25(7):1364-1381. doi: 10.1038/s41380-020-0767-8. Epub 2020 May 21. Mol Psychiatry. 2020. PMID: 32439846 Free PMC article.
-
Dopaminergic system in birdsong learning and maintenance.J Chem Neuroanat. 2010 Mar;39(2):112-23. doi: 10.1016/j.jchemneu.2009.10.004. Epub 2009 Nov 10. J Chem Neuroanat. 2010. PMID: 19900537 Free PMC article. Review.
-
Involvement of the GluN2A and GluN2B subunits in synaptic and extrasynaptic N-methyl-D-aspartate receptor function and neuronal excitotoxicity.J Biol Chem. 2013 Aug 16;288(33):24151-9. doi: 10.1074/jbc.M113.482000. Epub 2013 Jul 9. J Biol Chem. 2013. PMID: 23839940 Free PMC article.
-
NMDA Receptors: Distribution, Role, and Insights into Neuropsychiatric Disorders.Pharmaceuticals (Basel). 2024 Sep 25;17(10):1265. doi: 10.3390/ph17101265. Pharmaceuticals (Basel). 2024. PMID: 39458906 Free PMC article. Review.
References
-
- Akopian G, Walsh JP. Pre- and postsynaptic contributions to age-related alterations in corticostriatal synaptic plasticity. Synapse. 2006;60(3):223–238. - PubMed
-
- Bach ME, Barad M, Son H, Zhuo M, Lu YF, Shih R, Mansuy I, Hawkins RD, Kandel ER. Age-related defects in spatial memory are correlated with defects in the late phase of hippocampal long-term potentiation in vitro and are attenuated by drugs that enhance the cAMP signaling pathway. Proc Natl Acad Sci U S A. 1999;96(9):5280–5285. - PMC - PubMed
-
- Bito H, Deisseroth K, Tsien RW. CREB phosphorylation and dephosphorylation: a Ca(2+)- and stimulus duration-dependent switch for hippocampal gene expression. Cell. 1996;87(7):1203–1214. - PubMed
-
- Bozon B, Davis S, Laroche S. Regulated transcription of the immediate-early gene Zif268: mechanisms and gene dosage-dependent function in synaptic plasticity and memory formation. Hippocampus. 2002;12(5):570–577. - PubMed
Publication types
MeSH terms
Substances
Grants and funding
LinkOut - more resources
Full Text Sources
Miscellaneous
