. 2009 Jun 9;48(22):4762-71.
doi: 10.1021/bi9003765.

Crystal structures of cytochrome P450 2B4 in complex with the inhibitor 1-biphenyl-4-methyl-1H-imidazole: ligand-induced structural response through alpha-helical repositioning

Affiliations

Crystal structures of cytochrome P450 2B4 in complex with the inhibitor 1-biphenyl-4-methyl-1H-imidazole: ligand-induced structural response through alpha-helical repositioning

Sean C Gay et al. Biochemistry. .

Abstract

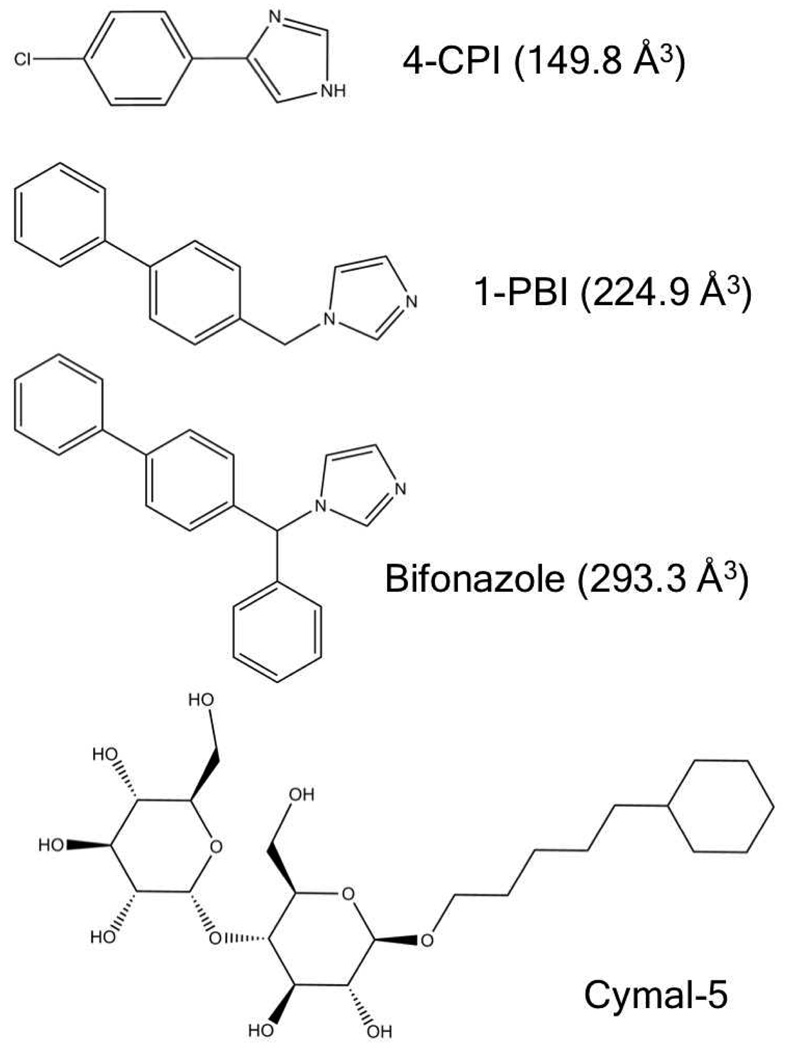
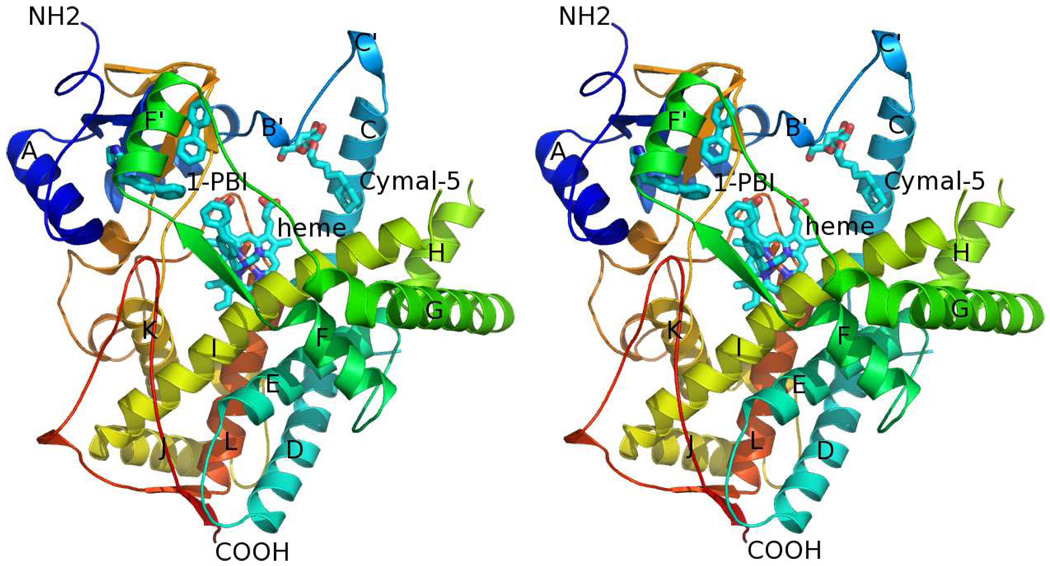
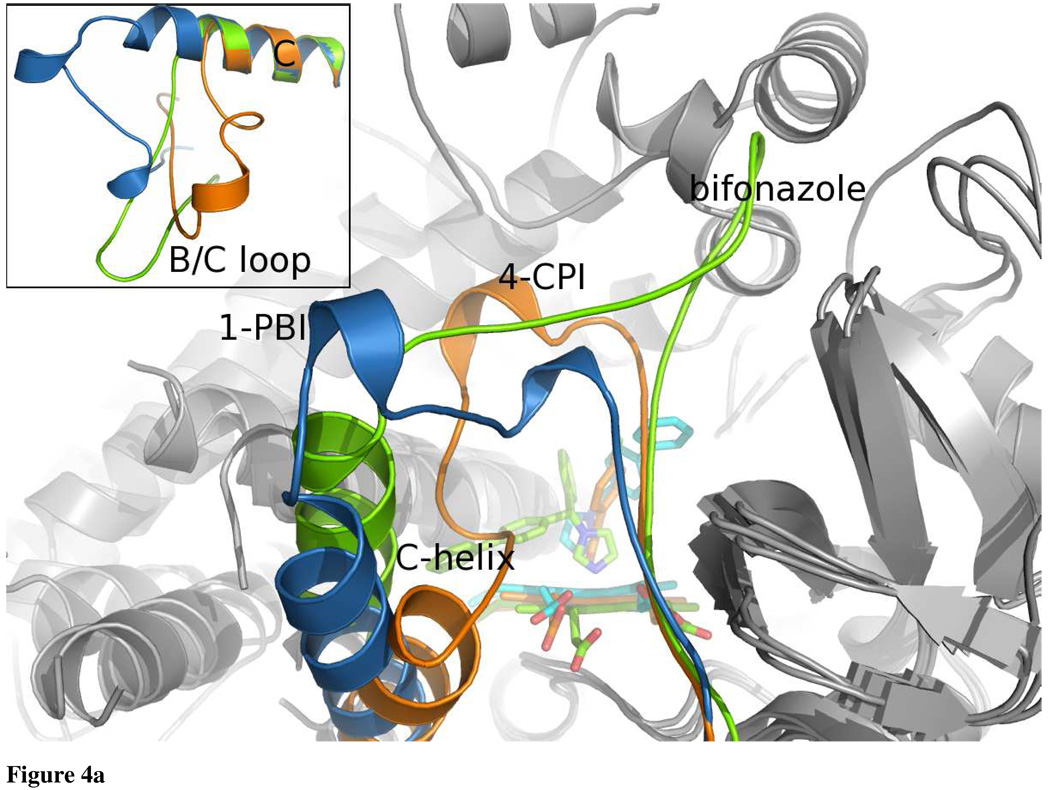
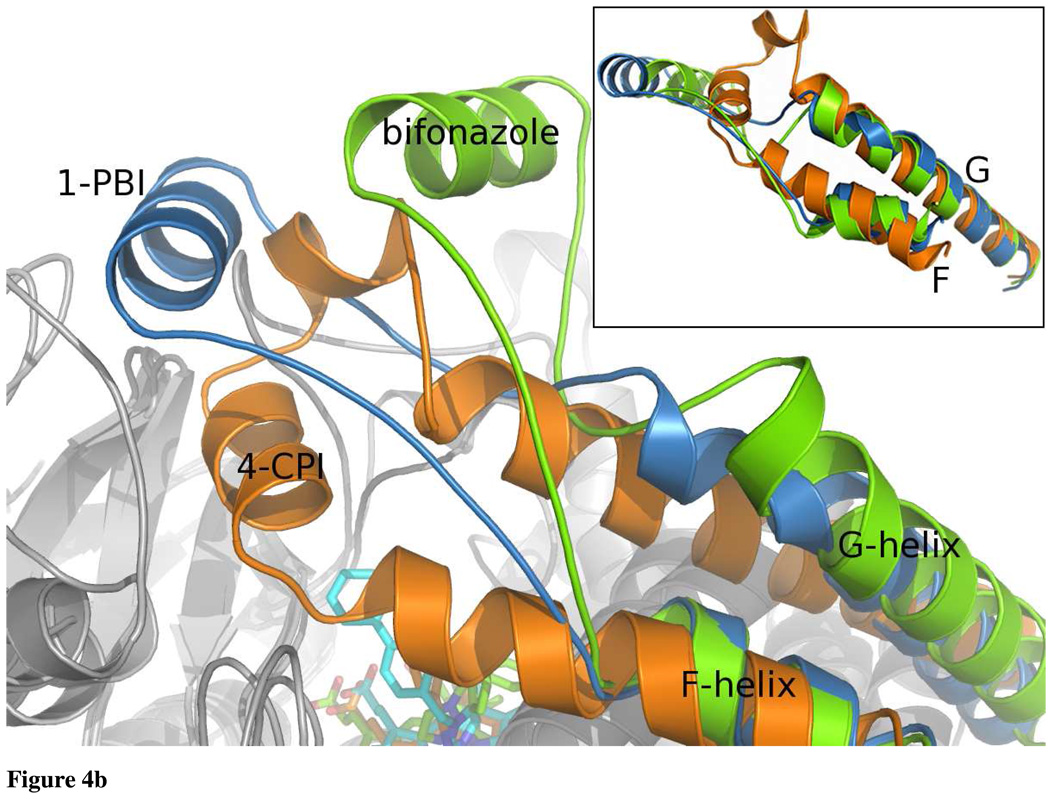
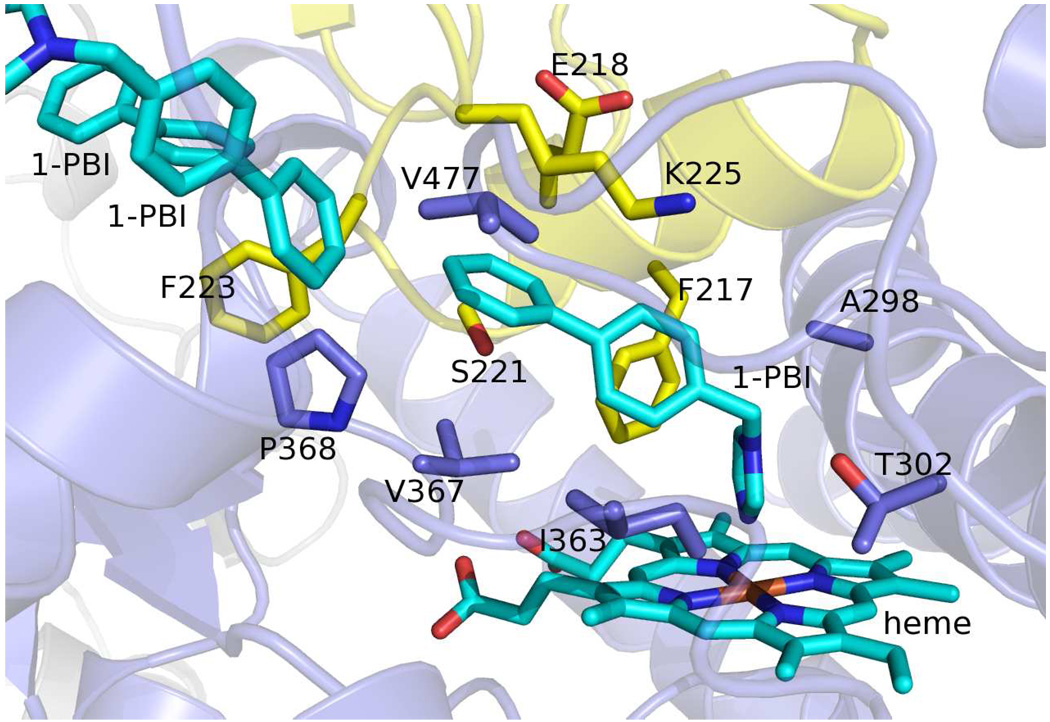
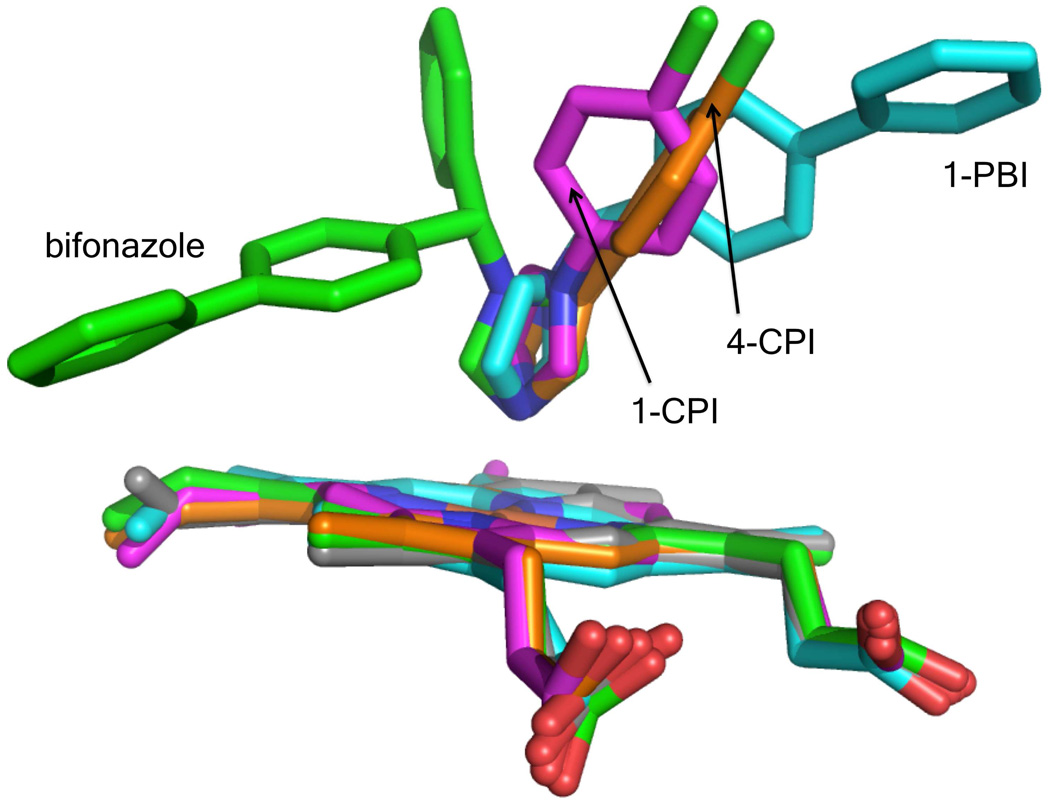
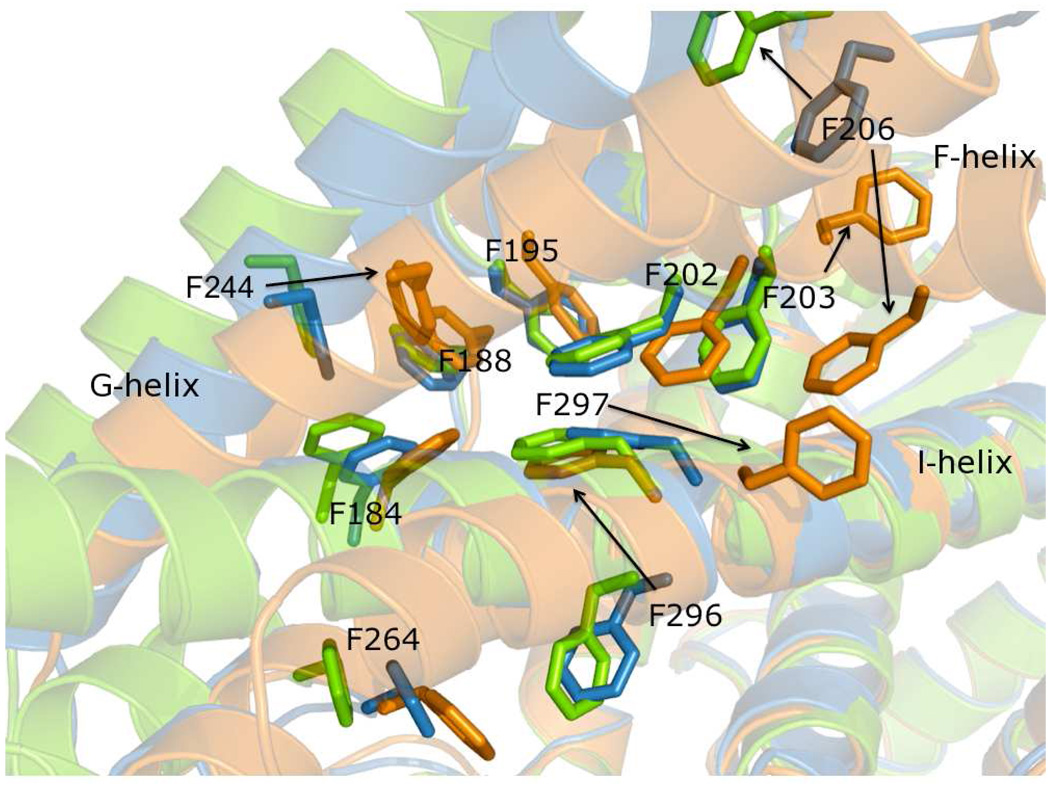
Two different ligand occupancy structures of cytochrome P450 2B4 (CYP2B4) in complex with 1-biphenyl-4-methyl-1H-imidazole (1-PBI) have been determined by X-ray crystallography. 1-PBI belongs to a series of tight binding, imidazole-based CYP2B4 inhibitors. 1-PBI binding to CYP2B4 yields a type II spectrum with a K(s) value of 0.23 microM and inhibits enzyme activity with an IC(50) value of 0.035 microM. Previous CYP2B4 structures have shown a large degree of structural movement in response to ligand size. With two phenyl rings, 1-PBI is larger than 1-(4-chlorophenyl)imidazole (1-CPI) and 4-(4-chlorophenyl)imidazole (4-CPI) but smaller than bifonazole, which is branched and contains three phenyl rings. The CYP2B4-1-PBI complex is a structural intermediate to the closed CPI and the open bifonazole structures. The B/C-loop reorganizes itself to include two short partial helices while closing one side of the active site. The F-G-helix cassette pivots over the I-helix in direct response to the size of the ligand in the active site. A cluster of Phe residues at the fulcrum of this pivot point allows for dramatic repositioning of the cassette with only a relatively small amount of secondary structure rearrangement. Comparisons of ligand-bound CYP2B4 structures reveal trends in plastic region mobility that could allow for predictions of their position in future structures based on ligand shape and size.


Figures

Figure 1
Figure 1
Stick model structures of 1-PBI, 4-CPI, and bifonazaole inhibitor molecules and Cymal-5 detergent. Volumes for inhibitors calculated using http://www.molinspiration.com/cgi-bin/properties are listed in parantheses.
Figure 2
Figure 2
Ribbon diagram of CYP2B4:1-PBI complex asymmetric unit looking down a non-crystallographic two-fold axis. Chain A is colored blue, chain B is colored yellow, chain C is colored red and chain D is colored green. Heme, 1-PBI, and Cymal-5 are shown as cyan (A), orange (B), salmon (C) and light green (D) sticks. a: The four chains form a tetramer that is a dimer of dimers. The A and B chains form one dimer and the C and D chains form the other dimer. b: Ribbon diagram of CYP2B4:1-PBI complex dimer looking down the other non-crystallographic two-fold axis. Coloring is the same as Fig. 2a and is rotated 90° with respect to Fig. 2a. Organic molecules are shown as cyan and orange sticks for the A and B chains respectively. The F’-helix of each monomer reaches across the dimer interface to interact with the active site of the other chain. The peripheral 1-PBI molecules bind at the dimer interface.
Figure 2
Figure 2
Ribbon diagram of CYP2B4:1-PBI complex asymmetric unit looking down a non-crystallographic two-fold axis. Chain A is colored blue, chain B is colored yellow, chain C is colored red and chain D is colored green. Heme, 1-PBI, and Cymal-5 are shown as cyan (A), orange (B), salmon (C) and light green (D) sticks. a: The four chains form a tetramer that is a dimer of dimers. The A and B chains form one dimer and the C and D chains form the other dimer. b: Ribbon diagram of CYP2B4:1-PBI complex dimer looking down the other non-crystallographic two-fold axis. Coloring is the same as Fig. 2a and is rotated 90° with respect to Fig. 2a. Organic molecules are shown as cyan and orange sticks for the A and B chains respectively. The F’-helix of each monomer reaches across the dimer interface to interact with the active site of the other chain. The peripheral 1-PBI molecules bind at the dimer interface.
Figure 3
Figure 3
Divergent stereoview of CYP2B4:1-PBI complex monomer A chain ribbon diagram. The chain is colored from blue to red from the N-terminus to the C-terminus respectively. Heme, 1-PBI, and Cymal-5 molecules are shown as cyan sticks. The F-, F’-, and G-helices rest across the I-helix forming a lid over the active site.
Figure 4
Figure 4
Ribbon diagram of CYP2B4:1-PBI, 4-CPI, and bifonazole complex overlays. a: The 1-PBI, 4-CPI, and bifonazole B/C loop and C-helix are colored blue, orange, and green respectively. The B/C loop rearranges itself in response to the various ligands bound to CYP2B4. Inset shows the B/C loop and C-helix overlaid apart from the overall protein structure. The C-helix is essentially identical in each, but large differences are seen in the position of the B/C loop. b: The 1-PBI, 4-CPI, and bifonazole F–G helix cassettes are colored coded as in Fig. 4a. The F-, F’-, and G-helices cassette pivots over the I-helix to accommodate the various inhibitor molecules bound to the active site heme. The size of the inhibitor (4-CPI<1-PBI<bifonazole) is somewhat proportional to the angle the cassette makes with repect to the I-helix. Inset shows the F-, F’-, and G-helices cassette overlaid apart from the overall protein structure. The N-terminus of the F-helix and the G-helix retain very similar structures; however the point at which the C-terminus of the F-helix unwinds as well as the secondary structure elements between the F- and G-helices changes in each structure.
Figure 4
Figure 4
Ribbon diagram of CYP2B4:1-PBI, 4-CPI, and bifonazole complex overlays. a: The 1-PBI, 4-CPI, and bifonazole B/C loop and C-helix are colored blue, orange, and green respectively. The B/C loop rearranges itself in response to the various ligands bound to CYP2B4. Inset shows the B/C loop and C-helix overlaid apart from the overall protein structure. The C-helix is essentially identical in each, but large differences are seen in the position of the B/C loop. b: The 1-PBI, 4-CPI, and bifonazole F–G helix cassettes are colored coded as in Fig. 4a. The F-, F’-, and G-helices cassette pivots over the I-helix to accommodate the various inhibitor molecules bound to the active site heme. The size of the inhibitor (4-CPI<1-PBI<bifonazole) is somewhat proportional to the angle the cassette makes with repect to the I-helix. Inset shows the F-, F’-, and G-helices cassette overlaid apart from the overall protein structure. The N-terminus of the F-helix and the G-helix retain very similar structures; however the point at which the C-terminus of the F-helix unwinds as well as the secondary structure elements between the F- and G-helices changes in each structure.
Figure 5
Figure 5
Semi-transparent ribbon and stick diagram of the CYP2B4:1-PBI complex active site. Chain A is colored blue and chain B is colored yellow. Heme and 1-PBI molecules are shown as cyan sticks. Side chains of residues identified within a 5 Å radius of the 1-PBI coordinated to the heme iron are shown as blue and yellow sticks.
Figure 6
Figure 6
Stick diagram of CYP2B4 heme and ligand overlay. The ligand free (gray) , 1-CPI (magenta), 4-CPI (orange), bifonazole (green), and 1-PBI (cyan) structures are shown. The active site heme remains in same orientation in each structure with only small changes. Each inhibitor molecule changes orientation in the different structures. The imidazole ring of 1-CPI and 4-CPI are in similar orientations, but the angle the ligand makes with respect to the heme differs as well as the conformation of the phenyl ring. The 1-PBI biphenyl moiety points in the same direction as the heme A ring propionate, but in bifonazole it is oriented directly between the C and D rings of the heme.
Figure 7
Figure 7
Transparent ribbon and stick diagram of CYP2B4 overlays highlighting the Phe cluster at the F-, G-, and I-helix intersection. The 4-CPI, 1-PBI, and bifonazole strucutres are shown in orange, blue, and green respectively. The cluster of Phe residues at this helical intersection reposition their side chains in each structure to fill void volumes as the F–G helix cassette pivots across the I-helix. Black arrows indicate large shifts in Phe location. The largest changes come at residue numbers 203, 206, 244, 296, and 297. The position of Phe 203 is conserved in the 1-PBI and bifonazole strucutres, but this residue swings around to the other side of the F-helix in the 4-CPI structure. Phe 206 diverges significantly in all structures based on the unraveling of the F-helix. The 4-CPI Phe 296 occupies the same place as Phe 297 in the 1-PBI and bifonazole structures. Phe 297 of the 4-CPI structure rotates around to interior of the active site.

Similar articles

Cited by

References

    1. Johnson EF, Stout CD. Structural diversity of human xenobiotic-metabolizing cytochrome P450 monooxygenases. Biochem Biophys Res Commun. 2005;338:331–336. - PubMed
    1. Al Omari A, Murry DJ. Pharmacogenetics of the Cytochrome P450 Enzyme System: Review of Current Knowledge and Clinical Significance. J Pharm Pract. 2007;20:206–218.
    1. Jabri E. P450 on drugs. Nat Struct Biol. 2003;10:587. - PubMed
    1. Li H, Poulos TL. Crystallization of cytochromes P450 and substrate-enzyme interactions. Curr Top Med Chem. 2004;4:1789–1802. - PubMed
    1. McLean KJ, Dunford AJ, Neeli R, Driscoll MD, Munro AW. Structure, function and drug targeting in Mycobacterium tuberculosis cytochrome P450 systems. Arch Biochem Biophys. 2007;464:228–240. - PubMed

Publication types

MeSH terms