

doi: 10.1111/j.1541-0420.2009.01189.x.
Assessing vaccine effects in repeated low-dose challenge experiments
Affiliations
- PMID: 19397589
- PMCID: PMC2794923
- DOI: 10.1111/j.1541-0420.2009.01189.x
Item in Clipboard
Assessing vaccine effects in repeated low-dose challenge experiments
Biometrics.
2009 Dec.
Abstract
Evaluation of HIV vaccine candidates in nonhuman primates (NHPs) is a critical step toward developing a successful vaccine to control the HIV pandemic. Historically, HIV vaccine regimens have been tested in NHPs by administering a single high dose of the challenge virus. More recently, evaluation of candidate HIV vaccines has entailed repeated low-dose challenges, which more closely mimic typical exposure in natural transmission settings. In this article, we consider evaluation of the type and magnitude of vaccine efficacy from such experiments. Based on the principal stratification framework, we also address evaluation of potential immunological surrogate endpoints for infection.
Figures

Left panel: Nonparametric (solid line) and parametric (dotted line) estimates of the survival functions based on data from Ellenberger et al. (2006) and fitted leaky vaccine model from Table 1. Right panel: Nonparametric estimates of the complementary log-log survival functions.
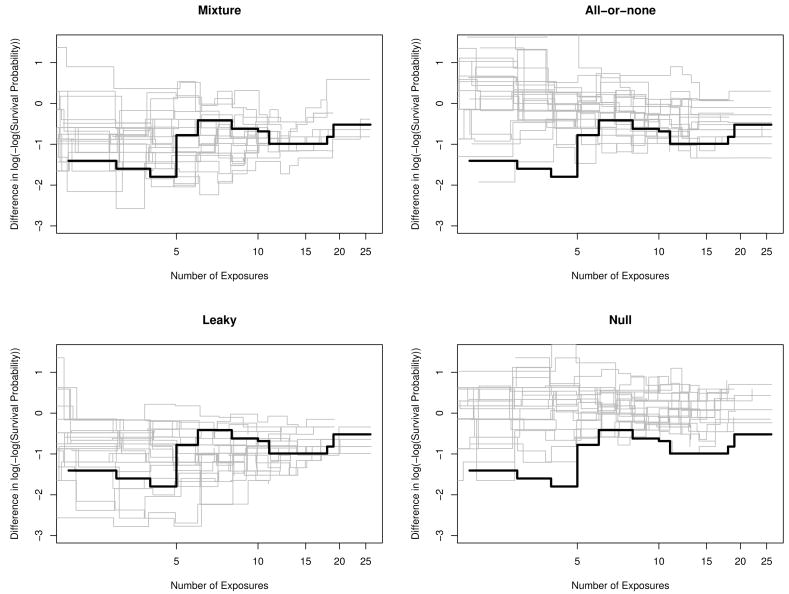
Difference in nonparametric estimates of the complementary log-log survival functions between the vaccine and control arms for the observed data (bold lines) and 25 simulated data sets (gray lines) for each of the four different mechanism of protection models.

Results from simulation study described in Section 3.2 with m = 20 NHPs per arm. Solid lines denote the true transmission probability curves p(z, s; β) for z = 0 (upper line) and z = 1 (lower line). Dotted lines depict the mean of the estimated curves p(z, s; β̂) over 500 simulated data sets.
References
-
- Chick SE, Barth-Jones DC, Koopman JS. Bias reduction for risk ratio and vaccine effect estimators. Statistics in Medicine. 2001;20:1609–1624. - PubMed
-
- Czeschinski P, Binding N, Witting U. Hepatitis A and hepatitis B vaccinations: immunogenicity of combined vaccine and of simultaneously or separately applied single vaccines. Vaccine. 2000;18:1074–1080. - PubMed
-
- Davison AC, Hinkley DV. Bootstrap Methods and Their Application. Cambridge University Press; 1997.
-
- Ellenberger D, Otten RA, Li B, Rodriguez V, Sariol CA, Martinez M, Monsour M, Wyatt L, Hudgens MG, Kraiselburd E, Moss B, Robinson H, Folks T, Butera S. HIV-1 DNA/MVA vaccination reduces the per exposure probability of infection during repeated mucosal SHIV challenges. Virlogy. 2006;352:216–225. - PubMed
-
- Farrington CP. Communicable diseases. In: Armitage P, Colton T, editors. Encyclopedia of Biostatistics. New York: Wiley; 1998. pp. 795–815.
Publication types
MeSH terms
Substances
Grants and funding
LinkOut - more resources
Full Text Sources
Other Literature Sources
