. 2009 May 11;206(5):1089-102.
doi: 10.1084/jem.20081605. Epub 2009 Apr 27.

M-CSF inhibition selectively targets pathological angiogenesis and lymphangiogenesis

Affiliations

M-CSF inhibition selectively targets pathological angiogenesis and lymphangiogenesis

Yoshiaki Kubota et al. J Exp Med. .

Abstract

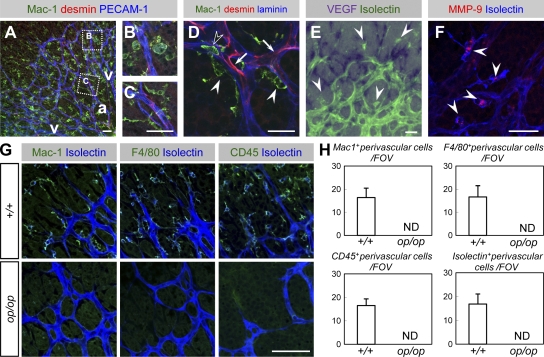
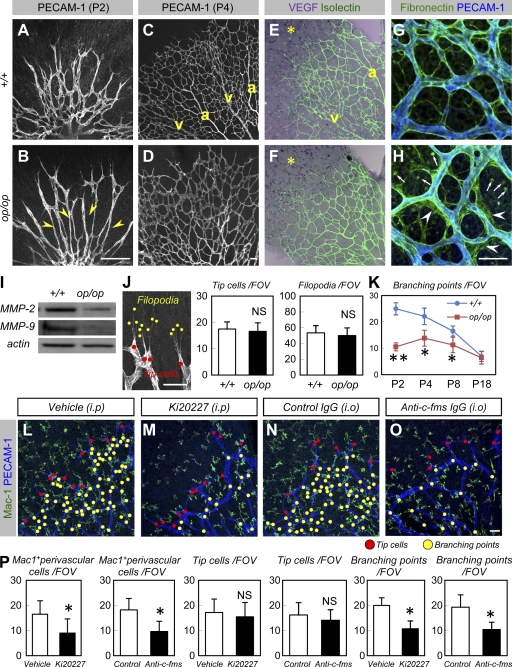
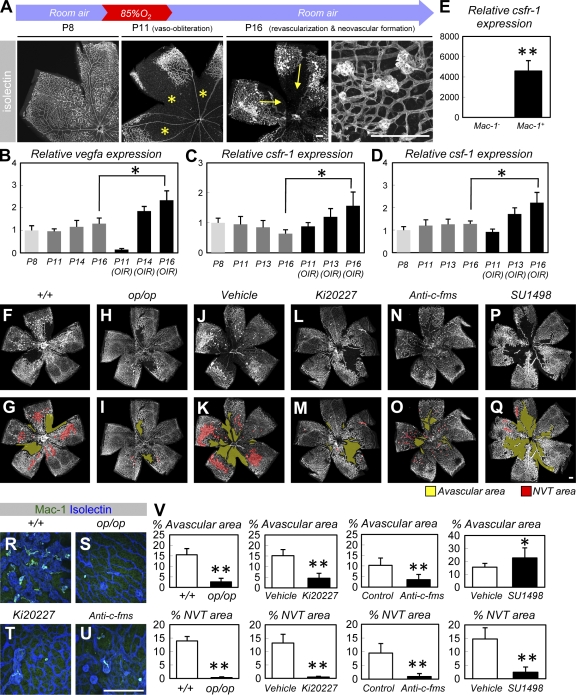
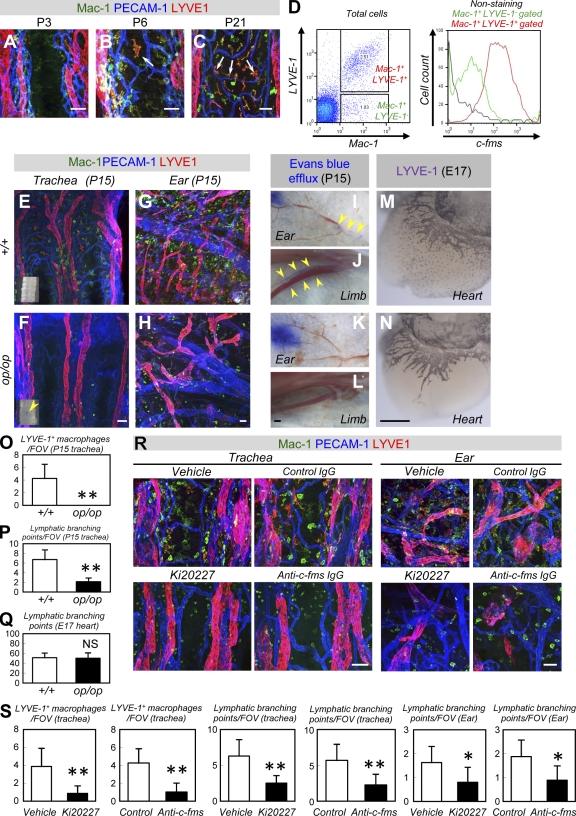
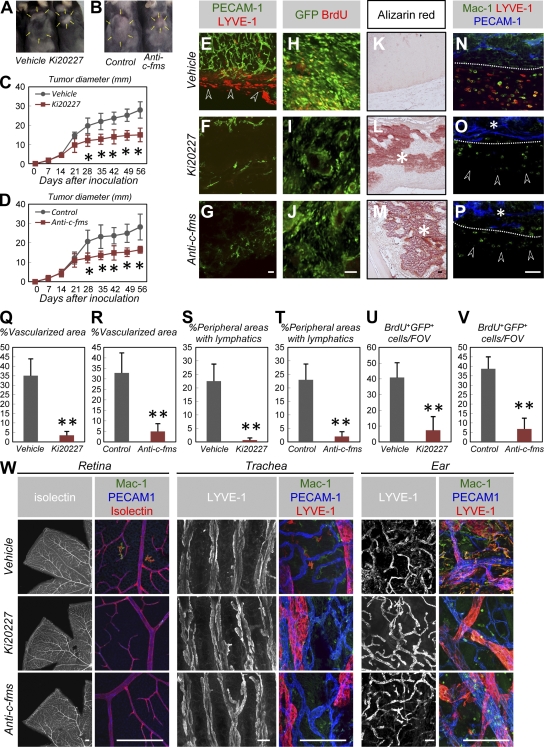
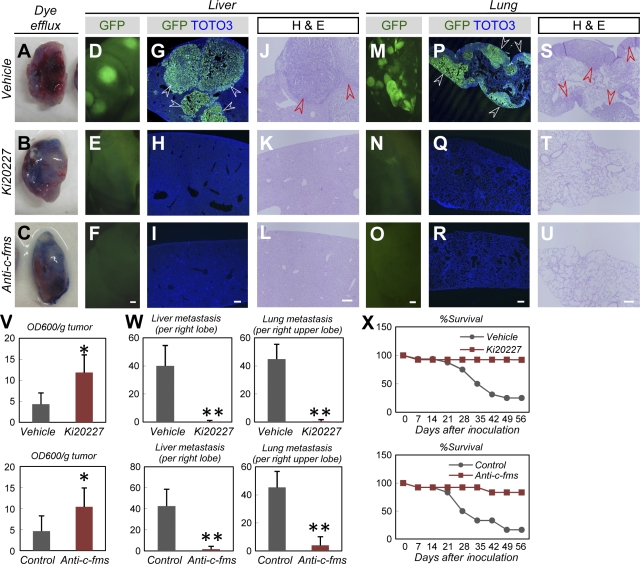
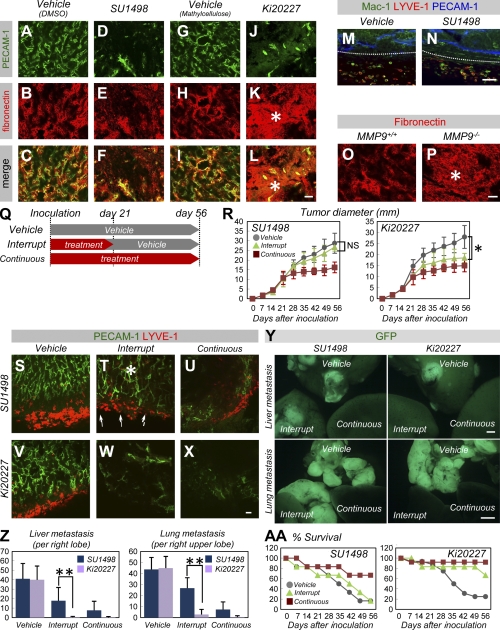
Antiangiogenic therapy for the treatment of cancer and other neovascular diseases is desired to be selective for pathological angiogenesis and lymphangiogenesis. Macrophage colony-stimulating factor (M-CSF), a cytokine required for the differentiation of monocyte lineage cells, promotes the formation of high-density vessel networks in tumors and therefore possesses therapeutic potential as an M-CSF inhibitor. However, the physiological role of M-CSF in vascular and lymphatic development, as well as the precise mechanisms underlying the antiangiogenic effects of M-CSF inhibition, remains unclear. Moreover, therapeutic potential of M-CSF inhibition in other neovascular diseases has not yet been evaluated. We used osteopetrotic (op/op) mice to demonstrate that M-CSF deficiency reduces the abundance of LYVE-1(+) and LYVE1(-) macrophages, resulting in defects in vascular and lymphatic development. In ischemic retinopathy, M-CSF was required for pathological neovascularization but was not required for the recovery of normal vasculature. In mouse osteosarcoma, M-CSF inhibition effectively suppressed tumor angiogenesis and lymphangiogenesis, and it disorganized extracellular matrices. In contrast to VEGF blockade, interruption of M-CSF inhibition did not promote rapid vascular regrowth. Continuous M-CSF inhibition did not affect healthy vascular and lymphatic systems outside tumors. These results suggest that M-CSF-targeted therapy is an ideal strategy for treating ocular neovascular diseases and cancer.


Figures

Figure 1.
Figure 1.
Characterization of macrophages in the developing retina. (A–C) Triple immunohistochemistry (IHC) of Mac-1 (green), desmin (red), and PECAM-1 (blue) within the P4 retina (representative images of three independent experiments). Macrophages in the venous/capillary (v) area possessed largely expanded cytoplasms and contained vesicles positive for PECAM-1 (B) in contrast to their lean bodies in the arterial area (a; C). (D) Triple IHC of Mac-1 (green), desmin (red), and laminin (blue; a representative image of three independent experiments). Macrophages (closed arrowheads) were identified in the perivascular space outside the basement membrane, whereas pericytes (arrows) and circulating monocytes (open arrowheads) were identified inside the basement membrane. (E) An ISH analysis of VEGF (purple) combined with isolectin B4 staining (green) of P4 (a representative image of six independent experiments). Macrophages (arrowheads) did not express VEGF, whereas astrocytes abundantly expressed VEGF. (F) An IHC analysis of MMP-9 (red) combined with isolectin B4 staining (blue; representative images of three independent experiments). MMP-9 was abundantly expressed in macrophages (arrowheads). (G) Double IHC of isolectin B4 (blue) and Mac-1, CD45, or F4/80 (green, as indicated) at P4 (representative images of eight independent experiments). Note that perivascular cells stained with Mac-1, CD45, F4/80, or isolectin were all identical and were absent from op/op mice. (H) Quantification of perivascular cells (mean ± SD) stained with Mac-1, CD45, or F4/80 (n = 8). Bars, 50 µm.
Figure 2.
Figure 2.
M-CSF contributes to developmental vascular remodeling. (A–D) An IHC analysis of PECAM-1 in P2 (A and B) and P4 (C and D) retinas (representative images of seven independent experiments). Note the reduced branching at P2 (indicated by arrowheads in B) and insufficient arterio-venous (a and v, respectively) patterning at P4 in op/op mice. (E and F) An ISH analysis of VEGF (purple) combined with isolectin B4 staining (green) at P4 (representative images of three independent experiments). VEGF expression (asterisks) was not altered in op/op mice. Also note the insufficient arterio-venous (a and v, respectively) patterning in op/op mice. (G and H) Double IHC of PECAM-1 (blue) and fibronectin (green) at P4 (representative images of four independent experiments). Note the irregular fibronectin proteins excessively deposited around the endothelial tubes (arrowheads) and rounded debris in the parenchymal area (arrows) in op/op mice. (I) Western blots of MMP-2 and MMP-9 in the P4 retina. Expression of MMP-2 and -9 decreased in the op/op mice. Representative panels are shown from three independent experiments. (J) The number of tip cells and filopodia (mean ± SD) were quantified as shown on the left (n = 7). (K) Quantification (mean ± SD) of branching points (n = 7). (L–O) Double IHC of Mac-1 (green) and PECAM-1 (blue) in P4 retinas after systemic treatment with vehicle (L) or Ki20227 (M) during P1–P4 or after intraocular injection with control IgG (N) or anti–c-fms IgG (O) at P1 (representative images of seven independent experiments). Note reduced branching points (yellow dots) and unaffected tip cells (red dots) in Ki20227-treated and anti–c-fms IgG-treated mice. Macrophages in retinas treated with Ki20227 and anti–c-fms antibodies exhibited insufficient stellate morphology and were present in lower numbers. (P) Quantification (mean ± SD) of Mac-1+ perivascular cells, tip cells, or branching points (n = 7). Bars, 50 µm. *, P < 0.05; **, P < 0.01.
Figure 3.
Figure 3.
M-CSF is required for pathological neovascularization but not for the recovery of normal vasculature in OIR. (A) Isolectin staining of retinas in an OIR model. The central area of established vasculature was obliterated by hyperoxic insult, resulting in an avascular area (asterisks). After returning the mice to room air, normal vasculature was recovered via revascularization (arrows), although NVTs proliferated toward the vitreous body. (B–D) Relative expression (mean ± SD) of vegf-a (B), csfr-1 (C), or csf-1 (D) in retinal tissues exposed to normoxic conditions or in an OIR model (n = 5; all experiments were performed in quadruplicate and the mean for each sample was obtained). (E) Relative expression (mean ± SD) of csfr-1 in FACS-sorted Mac-1+ or Mac-1 cells obtained from P16 retinas in an OIR model (n = 5). (F–Q) Isolectin staining of P16 retinas in an OIR model (representative images of six independent experiments). Note the decreased avascular area (yellow) and NVT area (red) in op/op mice (H and I) and mice systemically treated with Ki20227 (L and M) during P12 and P16 or in mice that were given intraocular anti–c-fms antibodies during P12 (N and O). Systemic treatment with SU1498 decreased NVT area and increased avascular area (P and Q). (R–U) Double IHC of Mac-1 (green) and isolectin (blue) in the P16 retinas of an OIR model. Macrophages in op/op retinas or retinas treated with Ki20227/anti–c-fms antibodies were reduced in number and exhibited insufficient stellate morphology. (V) Quantification (mean ± SD) of the avascular area or NVT area (n = 6). Bars, 200 µm. *, P < 0.05; **, P < 0.01.
Figure 4.
Figure 4.
M-CSF contributes to postnatal lymphatic development. (A–C) Triple IHC of Mac-1 (green), LYVE-1 (red), and PECAM-1 (blue) in tracheas (representative images of four independent experiments). Note the LYVE-1+ macrophages in the vascularized area (arrows). (D) FACS analysis of dissociated cells (a representative plot of three independent experiments). Note the more abundant expression of c-fms in LYVE-1+ than in LYVE-1 macrophages. (E–H) Whole-mount IHC of Mac-1 (green), LYVE-1 (red), and PECAM-1 (blue) in P15 tracheas (E and F) or ears (G and H; representative images of six independent experiments). Note the reduced lymphatic branching in op/op mice. Insets in E and F indicate bright field views of P15 trachea. Note the perforation typically seen in op/op mice (arrowhead). (I–L) Lymphangiography in ears (I and K) and limbs (J and L; representative images of three independent experiments). Note that the blue dye (arrowheads) observed in the lymphatic ducts of wild-type mice is not seen in op/op mice. (M and N) Whole-mount IHC of LYVE-1 in the hearts of E17 embryos (representative images of three independent experiments). The op/op mice exhibited normal lymphangiogenesis, although they lacked LYVE-1+ macrophages. (O–Q) Quantification (mean ± SD) of LYVE-1+ macrophages or lymphatic branching points (n = 6 [O and P]; n = 3 [Q]). (R) Triple IHC of Mac-1 (green), LYVE-1 (red), and PECAM-1 (blue) in P15 tracheas or ears systemically treated with vehicle (methylcellulose), Ki20227, control IgG, or anti–c-fms IgG during P8 and P15. Treatment with Ki20227 or anti–c-fms IgG decreased LYVE-1 and LYVE-1+ macrophages and reduced lymphatic branching (representative images of six independent experiments). (S) Quantification (mean ± SD) of LYVE-1+ macrophages or lymphatic branching points (n = 6). Bars: (I–N) 200 µm; (A–C, E–H, and R) 50 µm. *, P < 0.05; **, P < 0.01.
Figure 5.
Figure 5.
M-CSF inhibition selectively suppresses tumor angiogenesis and lymphangiogenesis in mouse osteosarcoma. (A and B) Typical appearance of mice 42 d after transplantation with AX cells. Arrows indicate tumor areas. (C and D) Quantification (mean ± SD) of tumor diameter (n = 5). (E–G) An IHC analysis of PECAM-1 (green) and LYVE-1 (red) in tumors 21 d after transplantation (representative images of seven independent experiments). Arrowheads in E indicate peritumoral lymphatics. Treatment with Ki20227 or anti–c-fms IgG decreased the amount of associated vascularization and peritumoral lymphatics. (H–M) An IHC analysis using GFP (green) and BrdU (red; H–J) or Alizarin red staining (K–M; representative images of five independent experiments). Treatment with Ki20227 or anti–c-fms IgG decreased BrdU incorporation into tumor cells but increased tumor calcification (asterisks). (N–P) An IHC analysis of Mac-1 (green), PECAM-1 (blue), and LYVE-1 (red) in tumors 21 d after transplantation. Dotted lines indicate tumor margins. Treatment with Ki20227 or anti–c-fms IgG decreased the peritumoral LYVE-1+ macrophages (arrowheads) and perivascular macrophages (asterisks) into tumors (representative images of seven independent experiments). (Q–T) Quantification (mean ± SD) of vascularized areas (Q and R) or peripheral areas with lymphatics (S and T; n = 7). (U and V) Quantification (mean ± SD) of BrdU+GFP+ cells (n = 5). (W) An IHC analysis using the indicated antibodies for adult retina, trachea, or ears after 56 d of treatment (representative images of four independent experiments). No vascular and lymphatic abnormalities were observed in mice treated with Ki20227 or anti–c-fms IgG, although these treatments decreased LYVE-1 and LYVE-1+ macrophages. Bars: (W) 200 µm; (E–P) 50 µm. *, P < 0.05; **, P < 0.01.
Figure 6.
Figure 6.
M-CSF inhibition suppresses tumor metastasis of mouse osteosarcoma and improves prognosis. (A–C) Representative appearance of tumors 2 h after injection with Evans blue dye (representative images of five independent experiments). (D–U) Fluorescent views (D–F and M–O), IHC for GFP (green) and TOTO3 (blue; G–I and P–R), or hematoxylin and eosin staining (J–L and S–U) in the liver or lung 56 d after tumor inoculation (representative images of five independent experiments). Note that the multiple metastatic masses (arrowheads) in control mice were completely absent in mice treated with Ki20227/anti–c-fms IgG. (V–X) Quantification (mean ± SD) of the OD600 measurements of extracted dye (V; n = 5), liver and lung metastasis at day 56 (W; n = 5), and survival rate (X; at least six mice were examined in each group). Bars, 200 µm. *, P < 0.05; **, P < 0.01.
Figure 7.
Figure 7.
M-CSF inhibition disorganizes extracellular matrices and suppresses tumor progression when treatment is interrupted. (A–L) An IHC analysis of PECAM-1 (green) and fibronectin (red) in tumors 21 d after transplantation (representative images of three independent experiments). Note that massively deposited fibronectin proteins were distributed throughout the tumors (asterisks) in Ki20227-treated mice but not in SU1498-treated mice, whereas tumor vasculature decreased in both mice. (M and N) An IHC analysis of Mac-1 (green), PECAM-1 (blue), and LYVE-1 (red) in tumors 21 d after transplantation (representative images of three independent experiments). Dotted lines indicate tumor margins. Treatment with SU1498 did not affect LYVE-1 or LYVE-1+ macrophages. (O and P) Fibronectin staining of tumors 21 d after transplantation into MMP-9+/+ or MMP-9−/− mice (representative images of three independent experiments). Note the presence of massively deposited fibronectin proteins (asterisk) in the MMP-9−/− mice. (Q) A modified scheme involving the administration of small molecule inhibitors. Administration was either continuous for 56 d (continuous) or terminated at day 21 (interrupt) after tumor inoculation. (R) Quantification (mean ± SD) of tumor diameter (more than five mice were examined in each regimen). (S–X) An IHC analysis of PECAM-1 (green) and LYVE-1 (red) in tumors 21 d after transplantation (representative images of three independent experiments). Although continuous SU1498 administration greatly inhibited vascular and lymphatic growth, interruption of treatment resulted in rapid vascular (asterisk) and lymphatic (arrows) regrowth. In contrast, Ki20227 reduced vasculature and lymphatics even after the interruption of treatment. (Y) Fluorescent views of liver or lung at day 56 in each regimen (representative images of five independent experiments). Although the interruption of SU1498 treatment caused multiple tumor metastases (as in vehicle treatment), metastatic masses were greatly reduced when Ki20227 treatment was interrupted. (Z) Quantification (mean ± SD) of liver and lung metastases at day 56 in each regimen (n = 5). (AA) Survival rate (more than five mice were examined in each regimen). Bars: (Y) 1 mm; (A–P and S–X) 50 µm. *, P < 0.05; **, P < 0.01.

References

    1. Carmeliet P. 2005. Angiogenesis in life, disease and medicine.Nature. 438:932–936 - PubMed
    1. Ferrara N., Kerbel R.S. 2005. Angiogenesis as a therapeutic target.Nature. 438:967–974 - PubMed
    1. Rudge J.S., Thurston G., Davis S., Papadopoulos N., Gale N., Wiegand S.J., Yancopoulos G.D. 2005. VEGF trap as a novel antiangiogenic treatment currently in clinical trials for cancer and eye diseases, and VelociGene-based discovery of the next generation of angiogenesis targets.Cold Spring Harb. Symp. Quant. Biol. 70:411–418 - PubMed
    1. Holash J., Davis S., Papadopoulos N., Croll S.D., Ho L., Russell M., Boland P., Leidich R., Hylton D., Burova E., et al. 2002. VEGF-Trap: a VEGF blocker with potent antitumor effects.Proc. Natl. Acad. Sci. USA. 99:11393–11398 - PMC - PubMed
    1. Pieramici D.J., Rabena M.D. 2008. Anti-VEGF therapy: comparison of current and future agents.Eye. 22:1330–1336 - PubMed

Publication types

MeSH terms

Substances