. 2009 May;133(5):525-46.
doi: 10.1085/jgp.200810153.

Intracellular calcium strongly potentiates agonist-activated TRPC5 channels

Affiliations

Intracellular calcium strongly potentiates agonist-activated TRPC5 channels

Nathaniel T Blair et al. J Gen Physiol. 2009 May.

Abstract

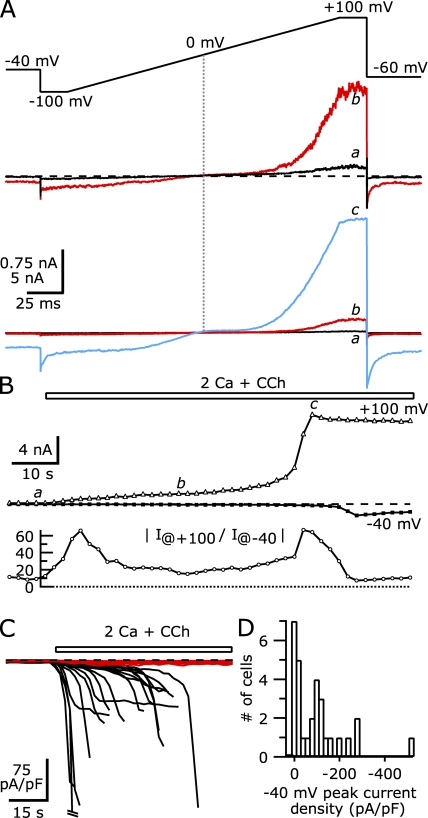
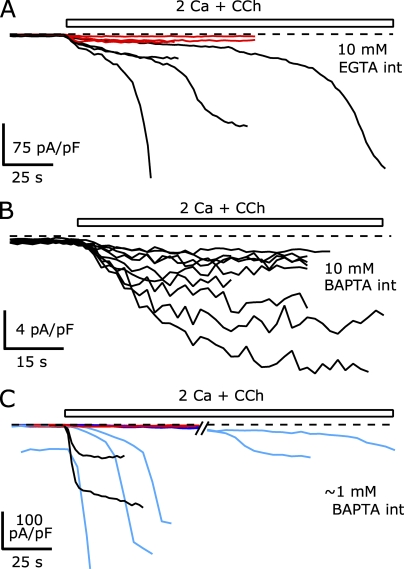
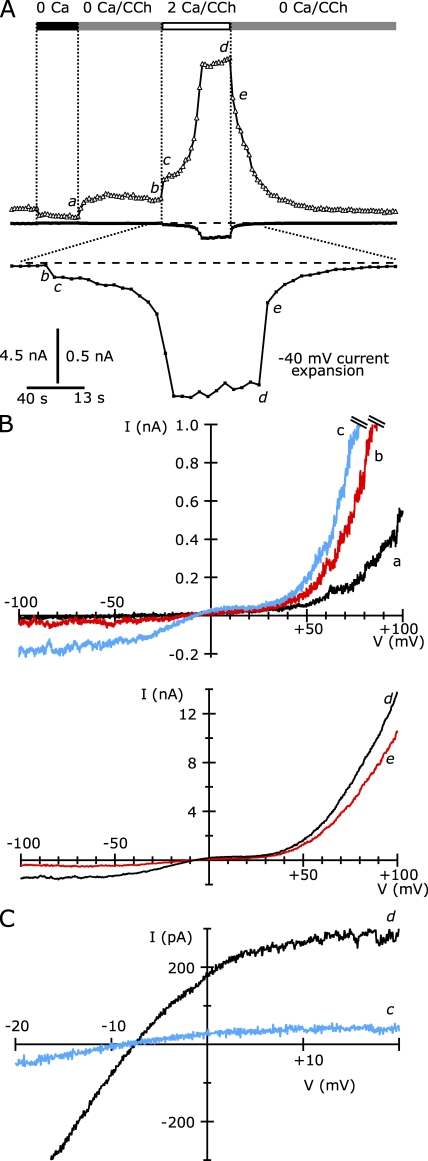
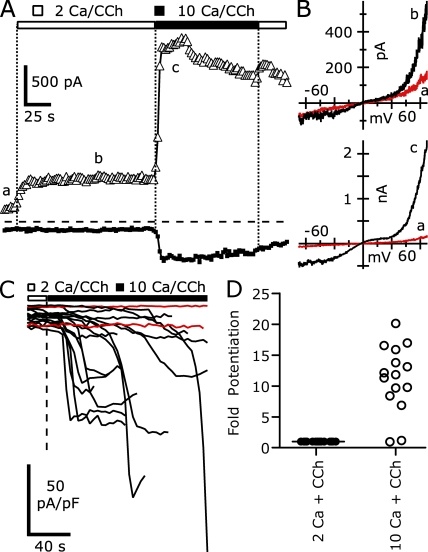
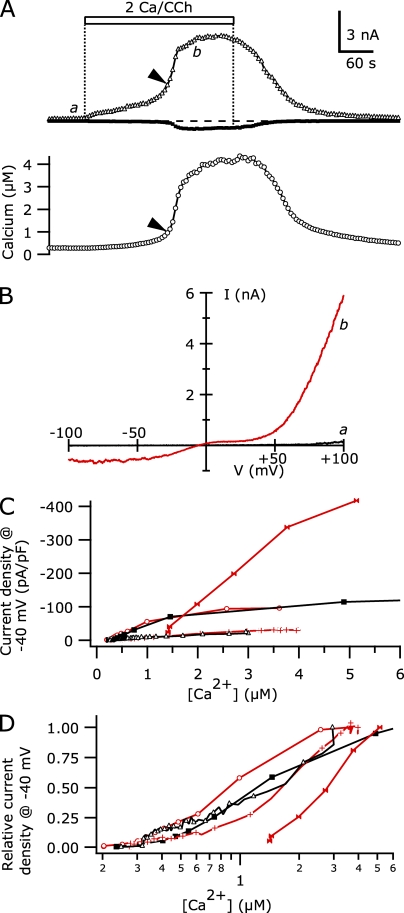
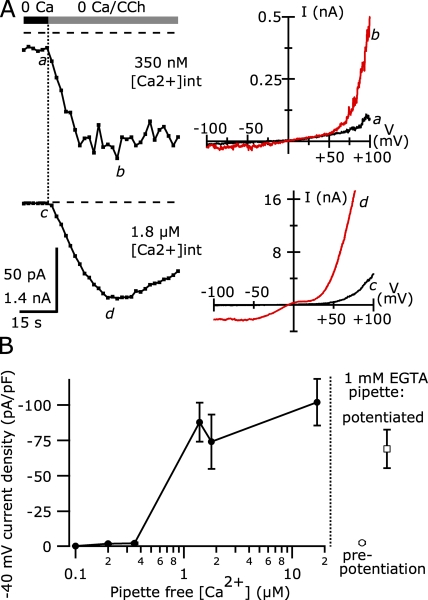
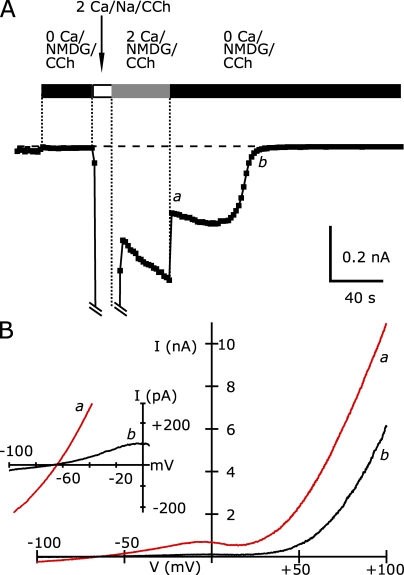
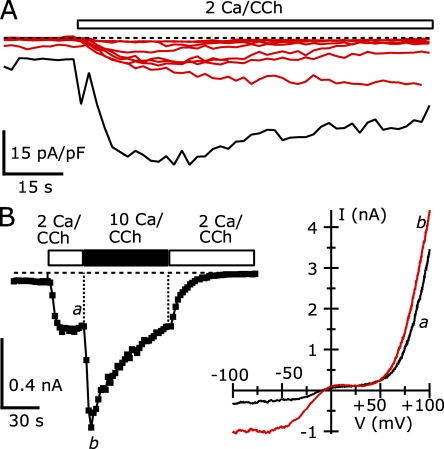
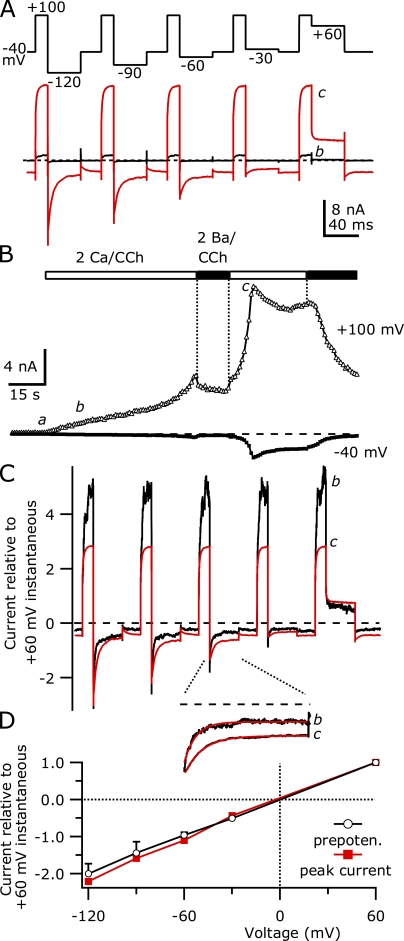
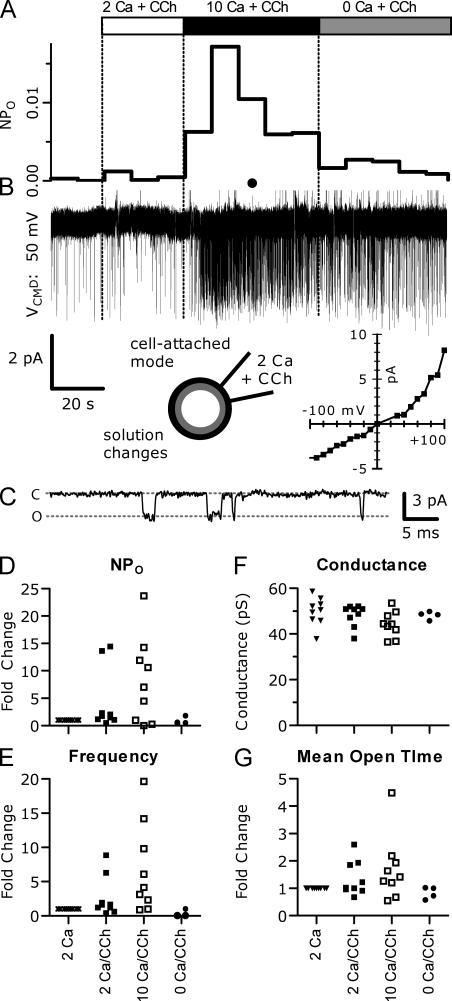
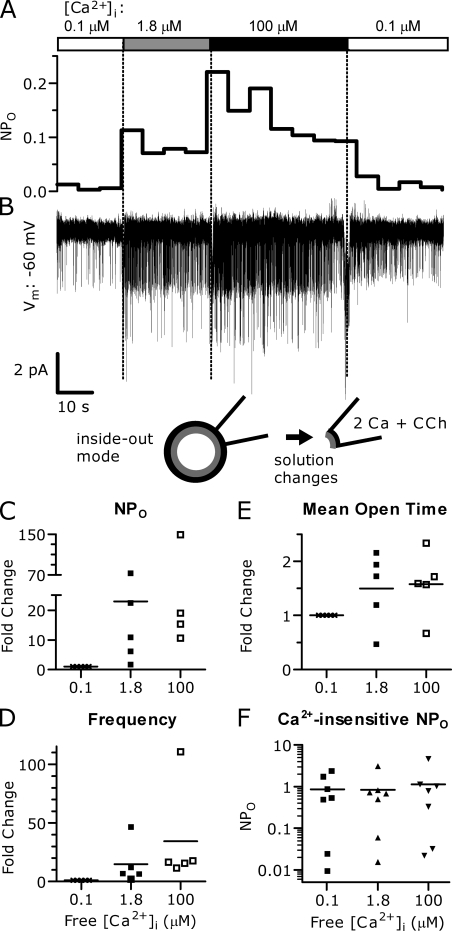
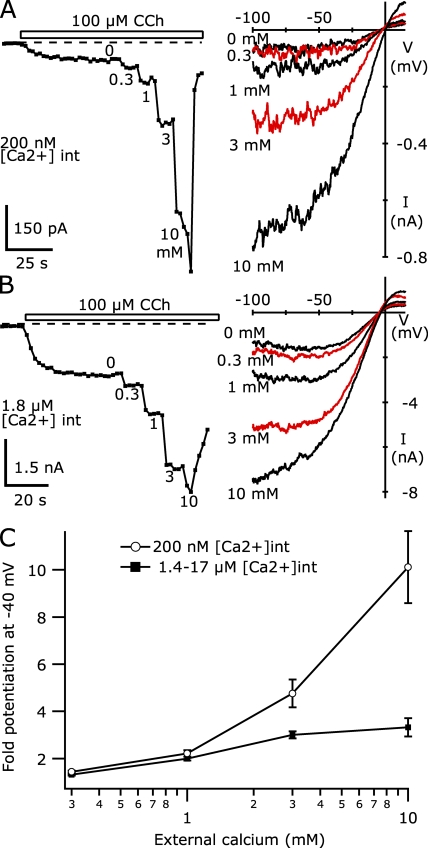
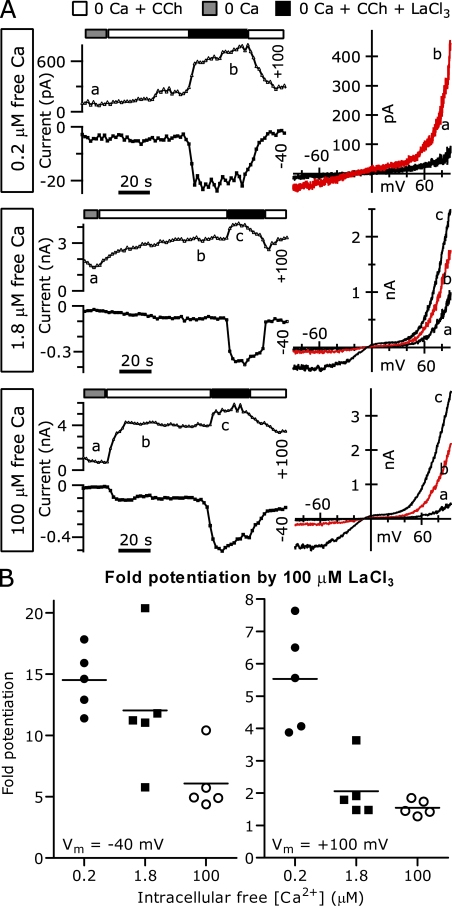
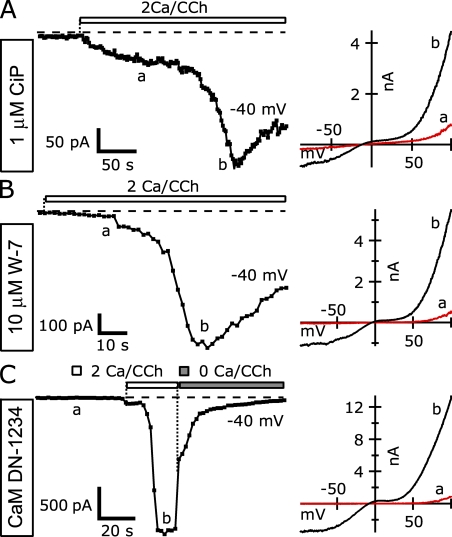
TRPC5 is a calcium (Ca(2+))-permeable nonselective cation channel expressed in several brain regions, including the hippocampus, cerebellum, and amygdala. Although TRPC5 is activated by receptors coupled to phospholipase C, the precise signaling pathway and modulatory signals remain poorly defined. We find that during continuous agonist activation, heterologously expressed TRPC5 currents are potentiated in a voltage-dependent manner ( approximately 5-fold at positive potentials and approximately 25-fold at negative potentials). The reversal potential, doubly rectifying current-voltage relation, and permeability to large cations such as N-methyl-d-glucamine remain unchanged during this potentiation. The TRPC5 current potentiation depends on extracellular Ca(2+): replacement by Ba(2+) or Mg(2+) abolishes it, whereas the addition of 10 mM Ca(2+) accelerates it. The site of action for Ca(2+) is intracellular, as simultaneous fura-2 imaging and patch clamp recordings indicate that potentiation is triggered at approximately 1 microM [Ca(2+)]. This potentiation is prevented when intracellular Ca(2+) is tightly buffered, but it is promoted when recording with internal solutions containing elevated [Ca(2+)]. In cell-attached and excised inside-out single-channel recordings, increases in internal [Ca(2+)] led to an approximately 10-20-fold increase in channel open probability, whereas single-channel conductance was unchanged. Ca(2+)-dependent potentiation should result in TRPC5 channel activation preferentially during periods of repetitive firing or coincident neurotransmitter receptor activation.


Figures

Figure 1.
Figure 1.
The activation of heterologously expressed TRPC5 channels by M1R stimulation is biphasic. (A) TRPC5 currents evoked by stimulation of M1Rs with 100 µM CCh were elicited by 200-ms voltage ramps from −100 to +100 mV, applied at 0.5 Hz from a holding potential of −40 mV. (Top) Ramp currents recorded before (a) and 30 s after CCh addition (b) are shown. (Bottom) After 60 s in CCh (c), the TRPC5 current suddenly increased ∼8.7-fold at +100 mV compared with b. The vertical scale bar corresponds to 0.75 nA in the top currents and 5 nA for the bottom. The dashed line indicates zero current level in this and all other figures. (B; Top) The current at +100 mV (open triangles, 5 ms average at end of ramp) and −40 mV (closed circles, 25 ms averaged immediately before ramp) are plotted. The open bar indicates the timing of the application of 100 µM CCh. (Bottom) The rectification of the TRPC5 current, calculated as the absolute value of the current at +100 mV divided by the current at −40 mV, is plotted (open circles). (C) Average current density at −40 mV evoked by 100 µM CCh is shown for 30 TRPC5/M1R-expressing cells. For clarity, traces are truncated after the peak current density; the peak of one cell is truncated by the vertical scale. Cells that displayed biphasic activation (18 of 30) are shown in black, whereas cells that displayed a single phase of activation (12 of 30) are shown in red. (D) Histogram of peak current density at −40 mV after CCh addition in TRPC5-expressing cells. Internal solution (in mM): 150 Cs-Asp, 2 MgCl2, 0.36 CaCl2, 1 EGTA, 4 MgATP, 0.3 NaGTP, and 10 HEPES, pH 7.20 with CsOH. External solution: 2 Ca external.
Figure 2.
Figure 2.
Increased internal Ca2+ buffering slows or prevents the delayed increase in CCh-activated TRPC5 current. The calculated free [Ca2+] for all internal solutions was ∼100 nM. The TRPC5 I-V curves were not affected by the composition of these internal solutions. (A) The average −40-mV current densities of eight cells recorded using an internal solution containing (in mM): 150 Cs-Asp, 2 MgCl2, 3.62 CaCl2, 10 EGTA, 4 MgATP, 0.3 NaGTP, and 10 HEPES, pH 7.20 with CsOH. The four cells where the peak current density at −40 mV remained less than −15 pA/pF during the CCh application are shown in red. (B) The average −40-mV current densities from nine cells recorded using an internal solution containing (in mM): 110 Cs-Asp, 10 CsCl, 2 MgCl2, 3.10 CaCl2, 10 Cs4-BAPTA, 4 MgATP, 0.3 NaGTP, and 10 HEPES, pH 7.20 with CsOH. (C) The average −40-mV current densities of nine cells recorded using either an internal solution containing (in mM): 146 Cs-Asp, 2 MgCl2, 0.31 CaCl2, 1 Cs4-BAPTA, 4 MgATP, 0.3 NaGTP, and 10 HEPES, pH 7.20 with CsOH (shown as black traces), or 145 Cs-Asp, 2 MgCl2, 0.307 CaCl2, 0.99 Cs4-BAPTA, 0.1 fura-2 (pentapotassium salt), 4 MgATP, 0.3 NaGTP, and 10 HEPES, pH 7.20 with CsOH (shown as blue traces). The two cells where peak current density at −40 mV remained less than −2.3 pA/pF are shown in red (the same fura-2–free internal solution as above). 95 s have been omitted from the trace to show the long latency peaks in two cells. External solution: 2 Ca external solution for each.
Figure 3.
Figure 3.
Removal of extracellular Ca2+ abolishes large-amplitude CCh-activated currents in TRPC5/M1R-expressing cells. (A; Top) The average currents at +100 mV (triangles) and −40 mV (squares) recorded during the application of ramp voltage stimuli in the presence of the external solutions indicated by the bars. The black bar indicates nominally Ca-free external, the gray bar indicates nominally Ca-free external with 100 µM CCh, and the open bar indicates 2 Ca external solution with 100 µM CCh. (Bottom) The average TRPC5 current at −40 mV on an expanded scale. The lowercase letters indicate the timing of the I-V curves elicited by voltage ramps shown in B. (B) I-V curves for TRPC5 current elicited by voltage ramps before (top) and after (bottom) potentiation. Note that the currents above 1 nA (∼+60 to +100 mV) are not shown (hatched bars; these currents continue upward at the same slope without saturation). (C) I-V curves near the TRPC5 reversal potential are shown immediately after the addition of external Ca2+ (c) and 48 s after current had reached the potentiated plateau (d) on an expanded scale to show reversal potentials. Internal solution (in mM): 150 Cs-Asp, 2 MgCl2, 0.31 CaCl2, 1 Cs4-BAPTA, 4 MgATP, 0.3 NaGTP, and 10 HEPES, pH 7.20 with CsOH. External solution: 2 Ca and nominally Ca-free external solutions had 1 and 3 mM MgCl2, respectively.
Figure 4.
Figure 4.
The application of 10 mM of extracellular Ca2+ rapidly induces large-amplitude TRPC5 currents in TRPC5 and M1R cotransfected HEK cells. (A) The average TRPC5-mediated currents at +100 mV (triangles) and at −40 mV (squares). Open and black bars indicate the timing of the addition of external solution. (B) I-V curves taken from ramps applied at the times shown by the lowercase letters in A. Currents before (top) and after (bottom) potentiation are shown. (C) The average current densities at −40 mV of 15 cells in response to 10 Ca external; before calcium increase, the bath contained 2 Ca external solution + 100 µM CCh. Cells that were potentiated are shown in black, and unpotentiated cells are shown in red. (D) Potentiation of current at −40 mV in 10 Ca2+ external (right) relative to 2 Ca external. Internal solution (in mM): 150 Cs-Asp, 2 MgCl2, 0.36 CaCl2, 1 EGTA, 4 MgATP, 0.3 NaGTP, and 10 HEPES, pH 7.20 with CsOH (100 nM calculated free [Ca2+]). External solution: 2 or 10 Ca external, both with 1 mM MgCl2.
Figure 5.
Figure 5.
TRPC5 current increases occur with intracellular [Ca2+] at ∼1 µM. (A; Top) The average currents at +100 mV (triangles) and −40 mV (squares) recorded during repetitive voltage ramp stimuli applied at 0.2 Hz during the addition of 100 µM CCh in 2 Ca external (open bar). (Bottom) Intracellular [Ca2+] monitored by fura-2 fluorescence recorded in the same cell. The arrowheads indicate the point at which the time derivative of the current at −40 mV reached 50% of its maximum. (B) I-V curves for current before (a) and during (b) the peak response to CCh application. (C) The current densities at −40 mV from CCh application to the peak value are plotted versus intracellular [Ca2+] for five cells that underwent potentiation. The time between symbols is 4 s for each cell, so that traces with more symbols represent cells with greater latencies to peak (e.g., latency to peak current was 48 s in the cell shown by open circles, whereas it was 216 s in the cell shown by open triangles). The [Ca2+] axis is truncated above 5 µM. The cell in A is shown by plus signs. Alternating cells are shown in red and black for clarity. (D) Current densities at −40 mV from C are normalized to their peak values and plotted against [Ca2+] on a log-scale (symbols correspond to the same cells). For clarity, cells with long peak latencies (shown as open triangles and plus signs) have only every third symbol displayed. Internal solution (in mM): 146 Cs-Asp, 2 MgCl2, 0.31 CaCl2, 0.99 Cs4-BAPTA, 0.1 fura-2, 4 MgATP, 0.3 NaGTP, and 10 HEPES, pH 7.20 with CsOH.
Figure 6.
Figure 6.
Internal free [Ca2+] > 1 µM dramatically increases TRPC5 current density. (A; Left) The average CCh-activated current at −40 mV in a TRPC5/M1R-expressing cell recorded with an internal solution containing ∼350 nM of calculated free [Ca2+] (top) and in a different cell recorded with an internal solution with ∼1.8 µM of calculated free [Ca2+] (bottom). The currents recorded with 350 nM of calculated free [Ca2+] are shown on an expanded current scale. (Right) I-V curves elicited by ramp voltage stimuli before the application of 100 µM CCh (a) and during the peak of the response (b). The external solution was nominally Ca free. The currents recorded with 350 nM of calculated free internal [Ca2+] were digitally smoothed using a Gaussian filter (−3db = 1 kHz; top). (B) The average peak CCh-activated current density at −40 mV from cells recorded with internal solutions with varying calculated free internal [Ca2+]. Also shown are the average current densities at −40 mV of CCh-activated TRPC5 currents in nominally Ca-free external solution before and after potentiation, recorded with 1 mM of EGTA-containing internal solutions. The average current density at −40 mV with 100 nM of calculated free [Ca2+] was −0.40 ± 0.08 pA/pF (n = 8), with 200 nM it was −2.08 ± 0.37 pA/pF (n = 22), and with 350 nM it was −2.44 ± 0.63 pA/pF (n = 8). Higher calculated free [Ca2+] values gave the following: 1.4 µM, −87.95 ± 13.81 pA/pF (n = 10); 1.8 µM: −74.13 ± 19.19 pA/pF (n = 7); and 17 µM: −102.03 ± 16.38 pA/pF (n = 9). Error bars represent ± SEM; missing error bars are smaller than symbols. Internal solutions with calculated [Ca2+] < 350 nM each contained (in mM): 110 Cs-Asp, 10 CsCl, 2 MgCl2, 10 Cs4-BAPTA, 4 MgATP, 0.3 Na-GTP, and 10 HEPES, pH 7.20 with CsOH, with 3.1 CaCl2 for 100 nM [Ca2+], 4.7 mM CaCl2 for 200 nM, and 6.0 mM CaCl2 for 350 nM. Internal solutions with calculated free [Ca2+] > 1 µM each contained (in mM): 150 Cs-Asp, 2 MgCl2, 4 MgATP, 0.3 NaGTP, and 10 HEPES, pH 7.20 with CsOH, and the following CaCl2 and HEDTA: 1.11 CaCl2 and 10 HEDTA for 1.4 µM [Ca2+], 0.43 CaCl2 and 5 HEDTA for 1.8 µM [Ca2+], and 1.89 CaCl2 and 5 HEDTA for 17 µM [Ca2+].
Figure 7.
Figure 7.
Potentiation by intracellular Ca2+ does not alter NMDG permeability of TRPC5. (A) The average −100-mV current preceding voltage ramps in response to the application of the indicated external solutions (5 ms at −100 mV immediately before the ramp was averaged in this case). Black bars indicate the addition of nominally Ca-free NMDG external, the open bar indicates the application of 2 Ca external solution, and the gray bar indicates the application of 2 Ca and NMDG external (100 µM CCh present throughout). (B) I-V relation of currents elicited by 200-ms voltage ramps recorded with nominally Ca-free NMDG/CCh external solution ∼2 s after the removal of external Ca2+ (a) and 64 s later (b). (Inset) The region near the reversal potential on an expanded scale. To emphasize the reversal potential, traces were digitally smoothed using a Gaussian filter (−3db = 500 Hz). Internal solution (in mM): 150 Cs-Asp, 2 MgCl2, 0.36 CaCl2, 1 EGTA, 4 MgATP, 0.3 NaGTP, and 10 HEPES, pH 7.20 with CsOH. External NMDG solutions (in mM): 150 mM NMDG-Cl, 4 KCl, 10 glucose, 10 HEPES, pH 7.40, with HCl, and 2 CaCl2 with 1 MgCl2 or 3 mM MgCl2 alone.
Figure 8.
Figure 8.
Heterologously expressed TRPC4β channels are potentiated by intracellular Ca2+. (A) TRPC4β current densities at −40 mV during the application of 100 µM CCh recorded from nine cells. One cell, with ∼−30 pA/pF current density, is shown in black; the remaining currents were less than −17 pA/pF and are shown in red. (B; Left) The application of 10 Ca external solution–potentiated TRPC4β channels. The average −40-mV current from a TRPC4β-expressing cell (not shown in A) in response to 100 µM CCh in standard 2 Ca external (open bar) or 10 Ca external (black bar). (Right) I-V relation of current elicited by voltage ramps applied at the times is indicated by lowercase letters. Internal solution contained (in mM): 150 Cs-Asp, 2 MgCl2, 0.36 CaCl2, 1 EGTA, 4 MgATP, 0.3 NaGTP, and 10 HEPES, pH 7.20. External solutions both contained 1 mM MgCl2.
Figure 9.
Figure 9.
The TRPC5 open channel I-V relationship does not change during intracellular calcium potentiation. (A) CCh-activated TRPC5 currents were elicited by 15-ms voltage steps to +100 mV, followed by 40-ms steps to multiple hyperpolarizing potentials (applied at 1 Hz). The black trace shows the current recorded ∼15 s after the addition of 100 µM CCh, and the red line shows the peak currents recorded 91 s after CCh addition (lowercase letters indicate sweep timing in B). (B) The average CCh-activated TRPC5 currents at +100 mV (triangles, final 3 ms of first +100-mV conditioning pulse) and −40 mV (squares, 10-ms average at sweep onset) during the application of 2 Ca external (open bars) and 2 Ba external solution (black bar). a, the timing of sweeps used for subtraction of the uncompensated capacity current. (C) Capacity-corrected traces from A were normalized to the amplitude of the TRPC5-mediated current 0.7 ms after repolarization to +60 mV to account for the large difference in absolute current amplitudes. The smaller relative +100-mV current in c likely indicates that the open probability at +60 and +100 mV are more similar after potentiation. The resulting instantaneous tail currents were similar. (Inset) The tail current at −60 mV on an expanded scale. The solid red lines show single-exponential fits to the current. (D) The size of the CCh-activated TRPC5 tail currents after normalization (as in C) was measured in three to six cells both before (black open circles, ∼30 or fewer seconds after CCh addition) and after (red squares, 100 s or fewer after CCh, when current reached peak amplitude) potentiation. Currents were measured 0.7–0.85 ms after the +100-mV conditioning pulse to allow any uncorrected fast capacity current to settle. Error bars show SEM; absent error bars are smaller than symbol. Internal solution (in mM): 150 Cs-Asp, 2 MgCl2, 0.36 CaCl2, 1 EGTA, 4 MgATP, 0.3 NaGTP, and 10 HEPES, pH 7.20 with CsOH (100 nM calculated free [Ca2+]). External solution: 2 Ca external and 2 Ba external (CaCl2 completely replaced by BaCl2; all else the same).
Figure 10.
Figure 10.
Potentiation of a single TRPC5 channel by Ca2+ in cell-attached recordings. (A) Channel activity as shown by continuous NPo trace (averaged 10-s bins). (B) The current trace recorded −50 mV relative to the cell membrane potential. Channel openings are downward deflections from the baseline. (Bottom right) Single-channel I-V relation. (C) Expanded trace for the region indicated by the black circle in B. C and O indicate closed and open levels, respectively. (D–G) Summary of single-channel properties from nine independent patches (normalized as fold change relative to preceding condition due to baseline NPo variability from patch to patch). The large increase in single-channel activity (NPo) evoked by the addition of 10 mM of extracellular Ca2+ in D (10.42 ± 2.8-fold; n = 7; P = 0.025), resulted from (E) increased channel-opening frequency (9.76 ± 2.13-fold; n = 8; P = 0.003) and (G) channel open time (2.09 ± 0.38-fold; n = 8; P = 0.011). (F) Single-channel conductance did not change. In this figure and Fig. 11, symbols represent patches recorded in the bath solutions indicated; for clarity, patches at similar amplitudes are offset horizontally and shown in different shapes for different solution conditions. Internal solution: standard 2 Ca external with 100 µM CCh. Bath solutions: 2 Ca and 10 Ca each had 1 mM MgCl2. Nominally Ca-free external had 3 mM MgCl2.
Figure 11.
Figure 11.
TRPC5 channel activity is potentiated by increases in [Ca2+] in excised (inside-out) single-channel recordings. The cytosolic face of TRPC5 channels was exposed to varying [Ca2+] using excised patches from TRPC5 and M1R cotransfected HEK cells. (A) Channel activity NPo trace from a single patch in response to changing Ca2+ (NPo was averaged over 5-s bins). (B) Current recorded at −60 mV; channel openings are downward deflections from the baseline. (C) Stimulation of peak NPo from five patches with containing TRPC5 channels (relative to 100 nM Ca2+, NPo in 1.8 µM of calculated Ca2+: 22.9 ± 13.1-fold [median 10.9; P = 0.043; t test]; in 100 µM Ca2+: 45.1 ± 26.27-fold [median 18.99; P = 0.048]). (D) Elevated cytosolic Ca2+ increases the frequency of channel openings. Fold increases were 14.81 ± 8.09 (median 6.89; n = 4; P = 0.032) in 1.8 µM Ca2+ and 34.42 ± 19.07 (median 16.57; n = 4; P < 0.0001) in 100 µM Ca2+. (E) Elevated cytosolic Ca2+ increased TRPC5 channel mean open time. Fold increase in mean open time was 1.5 ± 0.3-fold in 1.8 µM Ca2+ (n = 5; P = 0.01) and 1.58 ± 0.27-fold in 100 µM Ca2+ (n = 5; P = 0.001). (F) In seven additional patches, elevated Ca2+ did not increase NPo; these typically had high initial NPo. Internal solution: 2 Ca external with 100 µM CCh. Bath solutions: 0.1 µM of calculated free [Ca2+] solution (in mM): 150 Cs-Asp, 2 MgCl2, 0.36 CaCl2, 1 EGTA, 4 MgATP, 0.3 NaGTP, and 10 HEPES, pH 7.20 with CsOH. 1.4 µM of calculated free [Ca2+] solution (in mM): 150 Cs-Asp, 1.11 CaCl2, 10 HEDTA, 2 MgCl2, 4 MgATP, 0.3 NaGTP, and 10 HEPES, pH 7.20 with CsOH. 100 µM of free [Ca2+] solution (in mM): 150 Cs-Asp, 0.10 CaCl2, 2 MgCl2, 4 MgATP, 0.3 Na-GTP, and 10 HEPES, pH 7.20 with CsOH.
Figure 12.
Figure 12.
The extent of TRPC5 current potentiation by intracellular Ca2+ affects external Ca2+ current enhancement. (A) The average current at −40 mV recorded in a TRPC5/M1R-expressing HEK cell (left); internal solution with 200 nM of calculated free [Ca2+] containing (in mM): 110 Cs-Asp, 10 CsCl, 2 MgCl2, 4.7 CaCl2, 10 Cs4-BAPTA, 4 MgATP, and 0.3 NaGTP, pH 7.20 with CsOH. The right panels here and in B show the I-V curves from each initial sweep in different [Ca2+]. Currents recorded in 0.3 and 3 mM of external Ca2+ are shown in red; all others are shown in black. (B) The average current at −40 mV using an internal solution with 1.8 µM of calculated free [Ca2+] containing (in mM): 150 Cs-Asp, 2 MgCl2, 0.46 CaCl2, 5 HEDTA, 4 MgATP, and 0.3 NaGTP, pH 7.20 with CsOH. (C) Potentiation of current at −40 mV relative to that in nominally Ca-free external solution is plotted versus external [Ca2+] for cells recorded in 200 nM of internal calculated free [Ca2+] (open circles) or 1.4–17 µM of calculated free [Ca2+] (filled squares). Potentiation for the 200 nM Ca internal was 1.44 ± 0.05-fold for 0.3 Ca, 2.22 ± 0.14-fold for 1 Ca, 4.77 ± 0.59 for 3 Ca, and 10.11 ± 1.53 for 10 Ca (n = 6 each); whereas, for the >1.4 µM [Ca2+] internals it was 1.32 ± 0.04-fold, 2.00 ± 0.08, 3.09 ± 0.15, and 3.33 ± 0.39 (n = 10; n = 8 for 10 Ca external). External solutions had the following added divalents (in mM): 0 added CaCl2 with 3 MgCl2, 0.3 CaCl2 with 3 MgCl2, 1 CaCl2 with 2 MgCl2, 3 CaCl2 with 1 MgCl2, and 10 CaCl2 with 1 MgCl2.
Figure 13.
Figure 13.
Increased internal [Ca2+] depresses TRPC5 current potentiation by La3+. (A; Left) The average currents at +100 mV (triangles) and −40 mV (squares) recorded from TRPC5 and M1R cotransfected HEK cells during voltage ramps applied in the indicated solutions. (Right) I-V relations from the times indicated by lowercase letters. Boxes to the left of each trace indicate the calculated free [Ca2+] in the intracellular solution. (B) The average potentiation of TRPC5 current by 100 µM La3+. With 200 nM of calculated free [Ca2+] in the pipette, current at −40 mV was increased 14.53 ± 1.1-fold, and the current at +100 mV was increased 5.53 ± 0.71-fold. With 1.8 µM of calculated free [Ca2+] in the pipette, the current at −40 mV was increased 12.04 ± 2.35-fold, and the current at +100 mV was increased 2.06 ± 0.4-fold. With 100 µM of calculated free [Ca2+] in the pipette, the current at −40 mV was increased 6.07 ± 1.1-fold, and the current at +100 mV was increased 1.55 ± 0.1-fold (n = 5 for each). External solution was nominally Ca free to eliminate competition between Ca2+ and La3+ for the shared external binding site. Internal solutions: 0.2 µM of calculated free [Ca2+] (in mM): 110 Cs-Asp, 10 CsCl, 2 MgCl2, 10 Cs4-BAPTA, 4.7 mM CaCl2, 4 MgATP, 0.3 Na-GTP, and 10 HEPES, pH 7.20 with CsOH; 1.8 µM of calculated free [Ca2+] solution (in mM): 150 Cs-Asp, 0.43 CaCl2, 5 HEDTA, 2 MgCl2, 4 MgATP, 0.3 NaGTP, and 10 HEPES, pH 7.20 with CsOH; and 100 µM [Ca2+] solution (in mM): 150 Cs-Asp, 0.10 CaCl2, 2 MgCl2, 4 MgATP, 0.3 NaGTP, and 10 HEPES, pH 7.20 with CsOH. External solutions: 2 Ca and nominally Ca-free externals.
Figure 14.
Figure 14.
Calmodulin inhibition does not prevent potentiation of TRPC5 by intracellular Ca2+. (A–C; Left) The average currents at −40 mV (squares) recorded from TRPC5 and M1R cotransfected HEK cells during voltage ramps demonstrate Ca2+ potentiation in the presence of calmodulin inhibitors. (Right) I-V relations corresponding to points at left indicated by the lowercase letters. (A) Internal 1 µM of calmodulin inhibitory peptide (n = 5). (B) Internal 10 µM W-7 (n = 4). (C) Coexpression of a dominant-negative mutant calmodulin (CaM DN-1234) with TRPC5. Internal Solution (in mM): 150 Cs-Asp, 2 MgCl2, 0.36 CaCl2, 1 EGTA, 4 MgATP, 0.3 NaGTP, and 10 HEPES, pH 7.20 with CsOH (100 nM of calculated free [Ca2+]). External solution: 2 Ca and nominally Ca-free external.

References

    1. Bezzerides V.J., Ramsey I.S., Kotecha S., Greka A., Clapham D.E. 2004. Rapid vesicular translocation and insertion of TRP channels.Nat. Cell Biol. 6:709–720 - PubMed
    1. Biddlecome G.H., Berstein G., Ross E.M. 1996. Regulation of phospholipase C-beta1 by Gq and m1 muscarinic cholinergic receptor. Steady-state balance of receptor-mediated activation and GTPase-activating protein-promoted deactivation.J. Biol. Chem. 271:7999–8007 - PubMed
    1. Burgoyne R.D. 2007. Neuronal calcium sensor proteins: generating diversity in neuronal Ca2+ signalling.Nat. Rev. Neurosci. 8:182–193 - PMC - PubMed
    1. Chung M.K., Guler A.D., Caterina M.J. 2005. Biphasic currents evoked by chemical or thermal activation of the heat-gated ion channel, TRPV3.J. Biol. Chem. 280:15928–15941 - PubMed
    1. Chung M.K., Guler A.D., Caterina M.J. 2008. TRPV1 shows dynamic ionic selectivity during agonist stimulation.Nat. Neurosci. 11:555–564 - PubMed

Publication types

MeSH terms

LinkOut - more resources