

Noninvasive label-free imaging of microhemodynamics by optical-resolution photoacoustic microscopy
- PMID: 19399148
- PMCID: PMC2711847
- DOI: 10.1364/oe.17.007688
Noninvasive label-free imaging of microhemodynamics by optical-resolution photoacoustic microscopy
Abstract
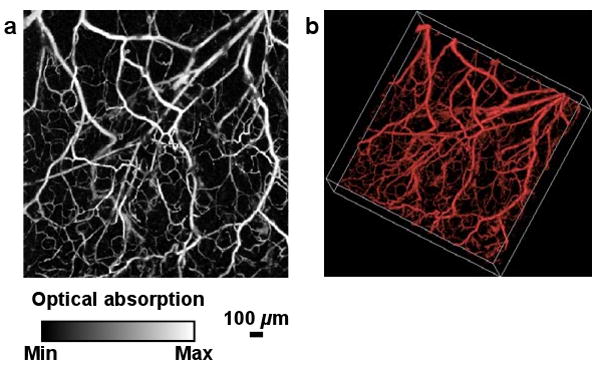
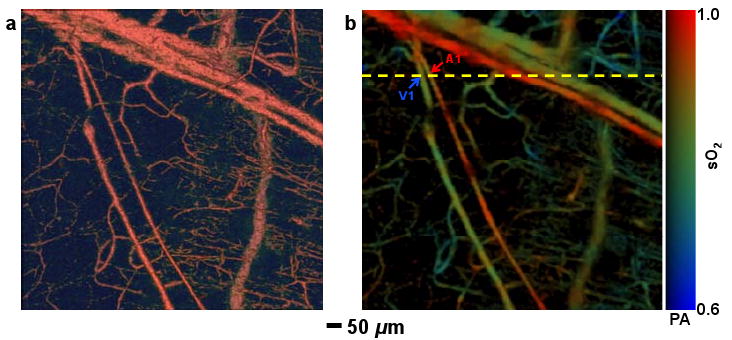
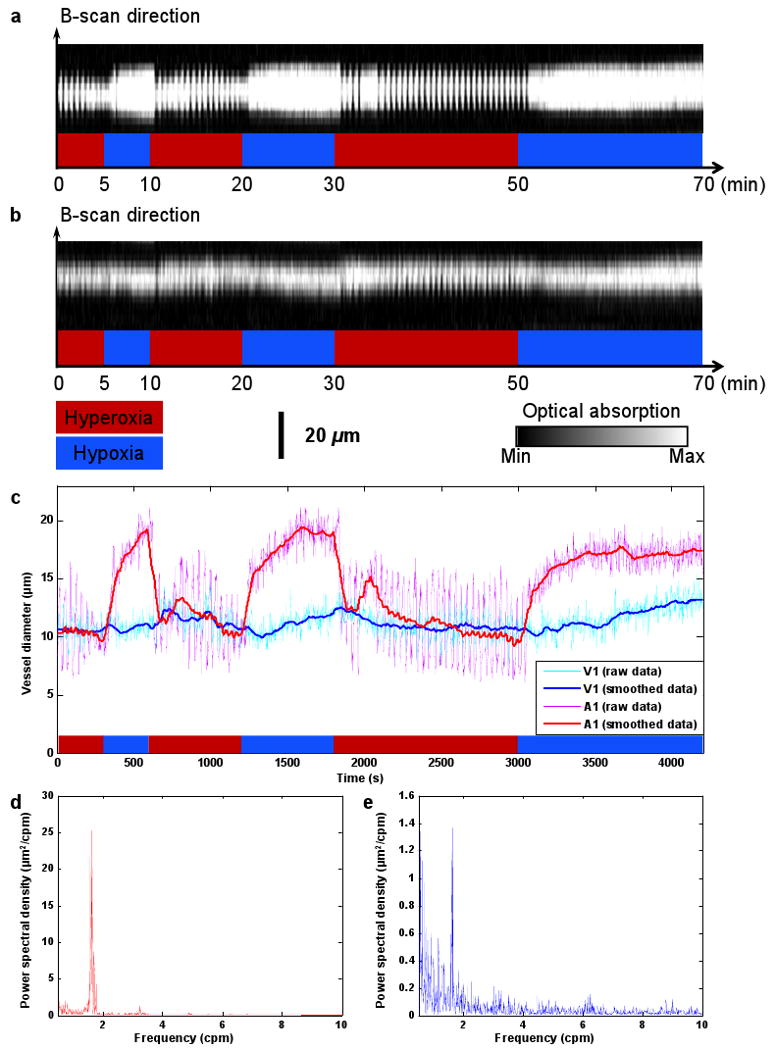
In vivo microcirculatory imaging facilitates the fundamental understanding of many major diseases. However, existing techniques generally require invasive procedures or exogenous contrast agents, which perturb the intrinsic physiology of the microcirculation. Here, we report on optical-resolution photoacoustic microscopy (OR-PAM) for noninvasive label-free microcirculatory imaging at cellular levels. For the first time, OR-PAM demonstrates quantification of hemoglobin concentration and oxygenation in single microvessels down to capillaries. Using this technique, we imaged several important yet elusive microhemodynamic activities-including vasomotion and vasodilation-in small animals in vivo. OR-PAM enables functional volumetric imaging of the intact microcirculation, thereby providing greatly improved accuracy and versatility for broad biological and clinical applications.
Figures
References
-
- Stern MD. In vivo evaluation of microcirculation by coherent light scattering. Nature. 1975;254:56–58. - PubMed
-
- Tooke JE. Microvasculature in diabetes. Cardiovasc Res. 1996;32:764–771. - PubMed
-
- Levy BI, Ambrosio G, Pries AR, Struijker-Boudier HA. Microcirculation in hypertension: a new target for treatment? Circulation. 2001;104:735–740. - PubMed
-
- Bongard O, Bounameaux H, Fagrell B. Effects of oxygen inhalation on skin microcirculation in patients with peripheral arterial occlusive disease. Circulation. 1992;86:878–886. - PubMed
-
- McDonald DM, Baluk P. Significance of blood vessel leakiness in cancer. Cancer Res. 2002;62:5381–5385. - PubMed
Publication types
MeSH terms
Grants and funding
LinkOut - more resources
Full Text Sources
Other Literature Sources
Miscellaneous
