. 2009;4(4):e5374.
doi: 10.1371/journal.pone.0005374. Epub 2009 Apr 28.

Neurodevelopment genes in lampreys reveal trends for forebrain evolution in craniates

Affiliations

Neurodevelopment genes in lampreys reveal trends for forebrain evolution in craniates

Adèle Guérin et al. PLoS One. 2009.

Abstract

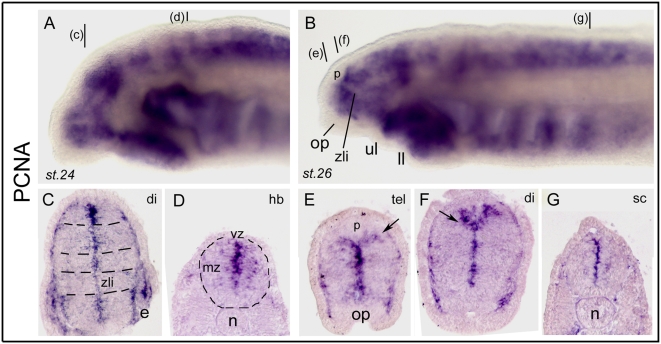
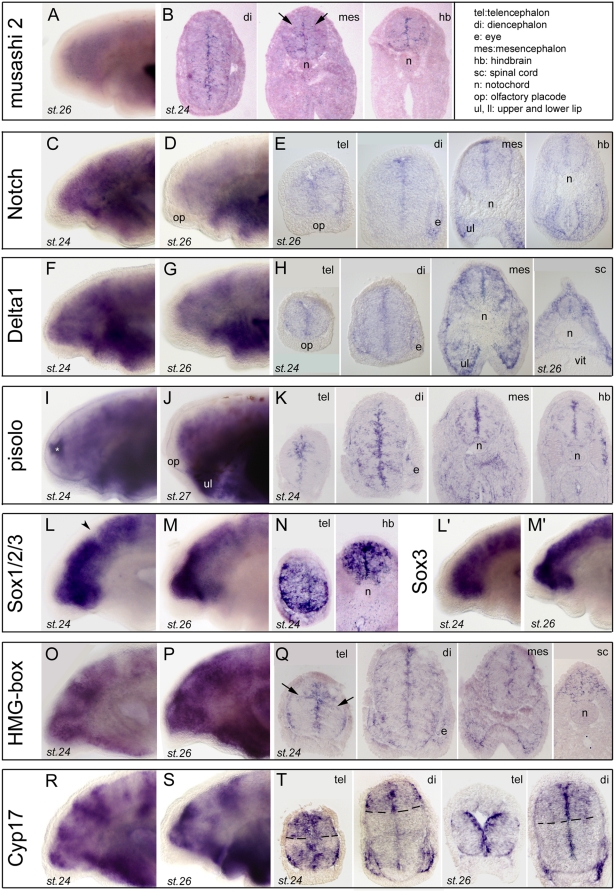
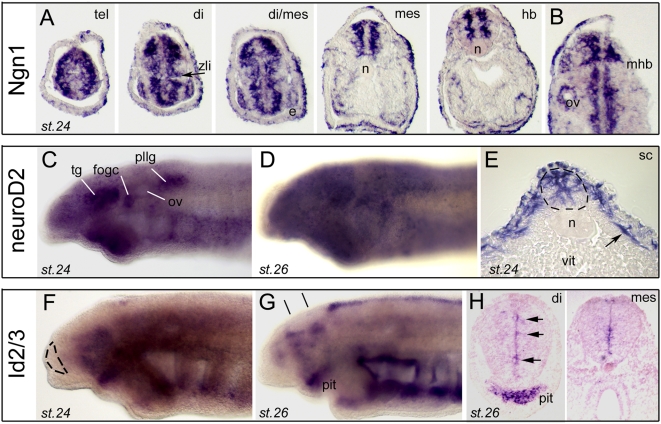
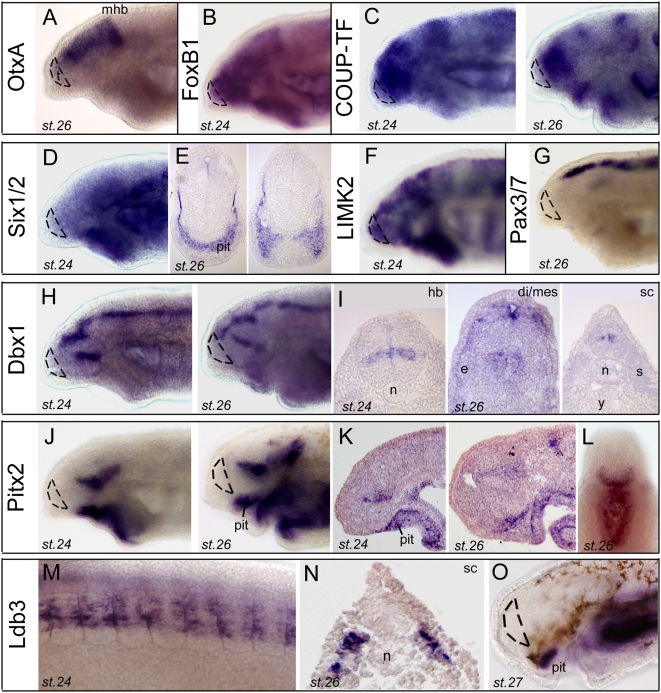
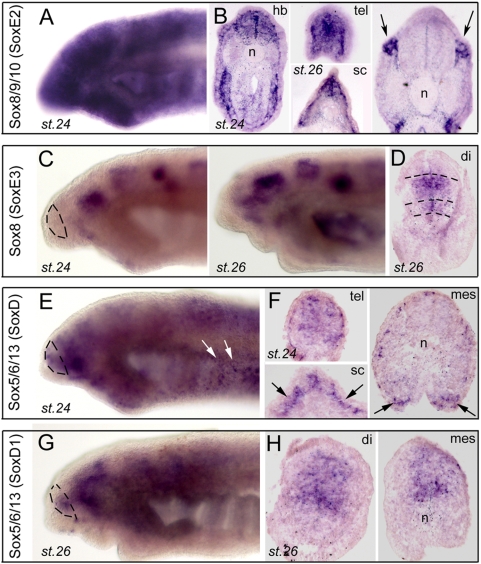
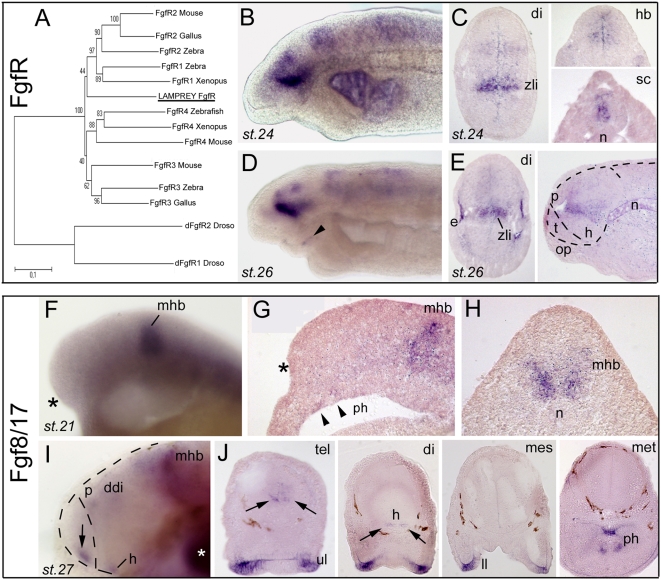
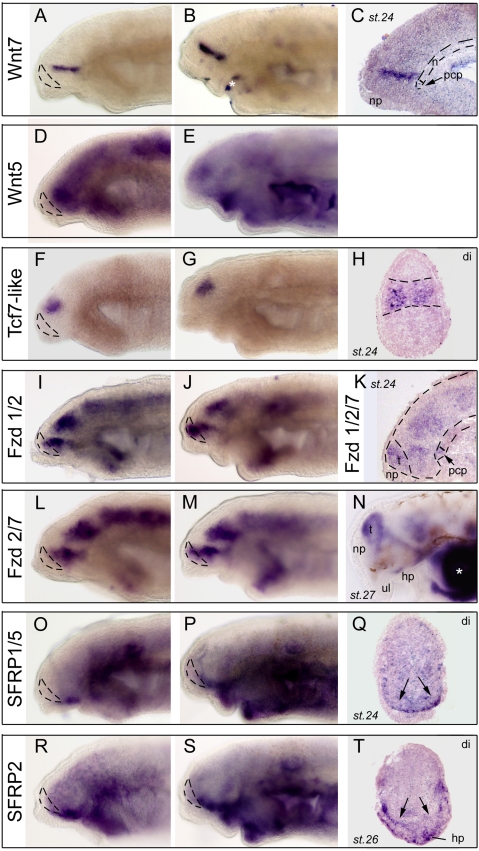
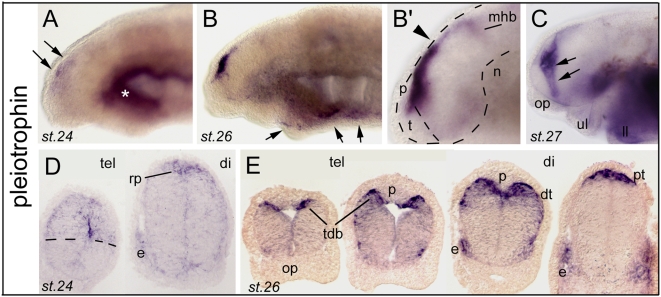
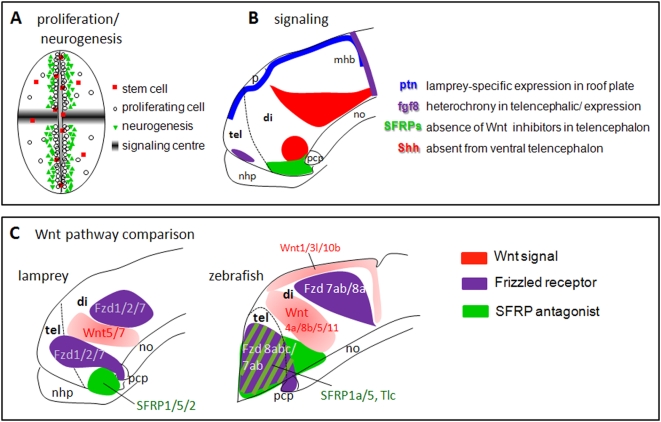
The forebrain is the brain region which has undergone the most dramatic changes through vertebrate evolution. Analyses conducted in lampreys are essential to gain insight into the broad ancestral characteristics of the forebrain at the dawn of vertebrates, and to understand the molecular basis for the diversifications that have taken place in cyclostomes and gnathostomes following their splitting. Here, we report the embryonic expression patterns of 43 lamprey genes, coding for transcription factors or signaling molecules known to be involved in cell proliferation, stemcellness, neurogenesis, patterning and regionalization in the developing forebrain. Systematic expression patterns comparisons with model organisms highlight conservations likely to reflect shared features present in the vertebrate ancestors. They also point to changes in signaling systems -pathways which control the growth and patterning of the neuroepithelium-, which may have been crucial in the evolution of forebrain anatomy at the origin of vertebrates.


Conflict of interest statement

Competing Interests: The authors have declared that no competing interests exist.

Figures

Figure 1
Figure 1. Developmental expression of lamprey PCNA.
A and B show in toto views, and C to G show transverse sections. In this and subsequent figures, anterior is to the left and dorsal is up for in toto images, the stage is indicated in the bottom left corner (st.24, st.26, or else), and section level is indicated in the top right corner of the photography (e.g., tel for telencephalon, di for diencephalon; see code in Figure 2 inset). In this figure only and to help the reader through the paper, the planes of section are indicated by black bars in A for the sections in C and D, and by black bars in B for the sections shown in EFG. In C, the dotted lines highlight the transverse domains which emerge from PCNA expression. In D, the circle delineates the contours of the neural tube. In E and F, the arrows point to the typical fork-like pattern reproducibly found at the dorsal midline just posterior to the pineal gland (p) and which probably corresponds to the dorsal thalamus (see text). zli: zona limitans intrathalamica; mz, vz, marginal and ventricular zone. Pictures shown are from clones 31 and 132.
Figure 2
Figure 2. Expression of stem cell and proliferation markers in lamprey developing brain.
A (toto) and B (sections) show lamprey musashi 2 (Msi2, clone 40). C,D (toto) and E (sections) show lamprey Notch (clone 49). F,G (toto) and H (sections) show lamprey Delta1 (clone 48). Vit, vitellus. I,J (toto) and K (sections) show lamprey pisolo (pictures taken from clone 169). The white asterisk in panel I indicates background trapping in the ventricle. L,M (toto) and N (sections) show a lamprey SoxB1 (Sox1/2/3) member, see also phylogeny for Sox genes in Figure S5). Toto views are from clone 38, and sections from clone 42. L',M' (toto) show another SoxB1 member identified as Sox3 (pictures taken from clone 137). O,P (toto) and Q (sections) show a lamprey HMG-box (toto view from clone 148, sections from clone 147). Arrows in panel 2Q indicate putative streams of radially migrating cells. R,S (toto) and T (sections) show lamprey Cyp17 (toto views are from clones 154 and 153, sections are from clone 152). Dotted lines in T highlight the “banded” pattern of expression of this transcript. The inset in the upper right corner gives the list of anatomical abbreviations used in this and other figures.
Figure 3
Figure 3. Developmental expression of proneural factors in lamprey brain.
A and B show Ngn1 expression (clone 88). A shows a complete antero-posterior series through forebrain of a stage 24 embryo, and B shows a horizontal section. The zli (zona limitans intrathalamica) and mhb (mid-hindbrain boundary) signaling centers are indicated. ov, otic vesicle. C,D (toto) and E (section) show NeuroD2 expression (pictures from clone 18). The arrow in E points to NeuroD2-expressing post-migratory neural crest. vit, vitellus. tg, fog, and pllg point to the trigeminal, facial/octaval and posterior lateral line ganglia, respectively. See Barreiro-Iglesias et al. 2008 in the open Journal of Zoology (Open access, indexed in Google Scholar) for localization of the lamprey ganglia. ov, otic vesicle. F,G (toto) and H (sections) show Id2/3 expression (toto views from clone 123, sections from clone 127). The dotted lines in F delineate the telencephalon. The black lines in G indicate the section plane of sections in panel H. Arrows indicate concentration/patches of ventricular expression. pit, pituitary.
Figure 4
Figure 4. Developmental expression of regionalization and tissue patterning genes in lamprey.
The dotted lines on in toto views delineate the telencephalon. pit, pituitary. A, OtxA (clone 93). The Lampetra fluviatilis clone shown is orthologous to the Lampetra japonica OtxA/Otx2 reported by Ueki et al. (1998) . B, FoxB1 (clone 17). C, COUP-TF/NR2F (clone 25). D (toto) and E (sections) show Six1/2 expression (clone 20). Note the conspicuous expression in the eyes and pituitary (pit). F, LIMk2 (clone 114). G, Pax3/7 (clone 69). H (toto) and I (sections) show Dbx1 expression (clone 19). J (toto), K (sections) and L (toto, ventral view, anterior is up) show Pitx2 expression (clone 113). M,O (toto) and N (section) show Ldb3 expression (clone 160). M is a lateral view at trunk level. N is a transverse section to show expression in somites.
Figure 5
Figure 5. Developmental expression of four lamprey Sox family members.
The dotted lines on in toto views delineate the telencephalon. A (toto) and B (sections) show a group E (Sox8/9/10) member (clone 37, orthologous to P.m SoxE2). Arrows point to neural crest-derived expressing ganglia. C (toto) and D (section) show Sox8 expression (clones 115,117,120, orthologous to L.j SoxE3). Shown are clones 115 (C, st.24) and 117 (C, st.26 and D). Dotted lines in D delineate the transverse diencephalic domains. E,G (toto) and F,H (sections) show expression of two lamprey group D (Sox5/6/13) members. Clone 116 (E,F) is expressed in both the brain and the neural crest (arrows in E and F), whereas clones 120 (G) and 122 (H) expression is restricted to the brain.
Figure 6
Figure 6. Developmental expression of Fgf signaling components in lamprey forebrain.
A, phylogenetic tree (NJ) of FgfR clones. A contig was assembled out of 7 independent clones (see Table 1), and analysis clearly shows that the unique FgfR present in our database emerges at the base of the tree, and cannot be assigned a robust orthology. B,D (toto) and C,E (sections) show expression of lamprey FgfR. Toto pictures are taken from clones 15 and 83, while section pictures are taken from clones 15 and 16. The right panel in E shows a saggital section, with dotted lines delineating the brain and telencephalon. F,I (toto) and G,H,J (sections; G saggital, H and J coronal) show Fgf8/17 expression (cDNA gift from Kate Hammond [46]). The asterisks in F and G point to the absence of Fgf at rostral telencephalic level at st. 21, whereas the mhb expresses strongly the transcript. Also note faint expression in the presumptive pharynx (arrowheads). The arrows in I and J points to rostral telencephalic expression at the rostral midline at stage 27. At st. 27, strong labeling is also present in the lips and pharynx. White asterisk in I: background trapping in branchial arch. ddi, dorsal diencephalon; h, hypothalamus; p, pineal gland; ph, pharynx.
Figure 7
Figure 7. Developmental expression of Wnt signaling components in lamprey forebrain.
A,B (toto) and C (saggital section) show Wnt7 expression pattern (clone 70). In C the arrow points to the prechordal plate (pcp) which does not express Wnt7. D,E, expression of Wnt5 in toto (clone73). F,G (toto) and H (section) show Tcf7-like (clone 24) expression as a very discrete and sharp domain in the diencephalon. I,J (toto) show expression of Frizzled 1/2 (I shows clone 101 and J shows clone 94). K (saggital section) shows another Frizzled 1/2/7 member (clone 100). Dotted lines delineate the brain, telencephalon and notochord, and the arrow points to the Fzd-expressing prechordal plate (pcp). L,M,N show in toto views of Frizzled2/7 (clone 95) through stage 27. O,P (toto) and Q (section) show SFRP1/5 expression. O and Q show clone 103 whereas P shows clone 102. R,S (toto) and T (section) show SFRP2 expression. R and T show clone 97 whereas S shows clone 96. On whole-mount pictures, dotted lines delineate the telencephalon. Arrows in Q and T indicate basal hypothalamic expression. White asterisks indicate background trapping in the mouth or branchial arches. np, nasal placode; hp, hypophyseal placode.
Figure 8
Figure 8. Developmental expression of pleitrophin (Ptn) in lamprey forebrain.
A to C (toto) and DE (sections) show Ptn expression. AB show clone 161 and B'CDE show clone 163. Note that expression is diffuse at stage 24 (A, D) and condenses at the dorsal midline at stage 26 (B, B') and 27 (E). Arrows in A point to dorsal telencephalic and dorsal diencephalic expression. Arrows in B indicate a thin line of expression in lower lip (ll) and ventral aspect of the branchial arches. In B' and D, rp indicates the roof plate. Note the difference of expression level at the di-mesencephalic border (arrowhead in B') between the pretectum (pt) and the tectum. In C, the arrows point to the Ptn-expressing tel-diencephalic boundary. E shows an antero-posterior series through the telencephalon and tel-diencephalic boundary, highlighting the relationship of the Ptn pattern and the suspected morphogenetic movements in the vicinity of the pineal gland (p). tdb indicates the telencephalo-diencephalic boundary region. rp, roof plate; dt, dorsal thalamus; p, pineal gland; pt, pretectum.
Figure 9
Figure 9. Conserved proliferation and neurogenesis processes, but divergent signaling mechanisms in the forebrain in lampreys and gnathostomes.
A and B summarize the main findings of this study. In A, the neurogenesis pattern schematized is highly comparable to what has been found in jawed vertebrates. By contrast, in B, four major signaling systems which control the growth, the patterning, and the morphogenesis of the forebrain are depicted, and the type of difference when compared to jawed vertebrates is indicated. C provides a more detailed comparison of the Wnt signaling pathways in embryonic lampreys (present data) and in zebrafish (compiled from ZFIN and [56]). It should be noted that the absences of expression we observed for signaling systems in telencephalon await for evidences from functional and/or complete genomic data that these apparent lacks are not compensated by other family members.

References

    1. Ota KG, Kuratani S. The history of scientific endeavors towards understanding hagfish embryology. Zoolog Sci. 2006;23:403–418. - PubMed
    1. Osorio J, Rétaux S. The lamprey in evolutionary studies. Dev Genes Evol. 2008;218:221–235. - PubMed
    1. Kuratani S, Kuraku S, Murakami Y. Lamprey as an evo-devo model: lessons from comparative embryology and molecular phylogenetics. Genesis. 2002;34:175–183. - PubMed
    1. Bullock TH, Moore JK, Fields RD. Evolution of myelin sheaths: both lamprey and hagfish lack myelin. Neurosci Lett. 1984;48:145–148. - PubMed
    1. Butler AB, Hodos W. The forebrain: telencephalon. In: Butler AB, Hodos W, editors. Comparative vertebrate neuroanatomy. New York: Wiley-Liss; 1996. pp. 349–437.

Publication types

Substances