. 2009 May;72(3):645-57.
doi: 10.1111/j.1365-2958.2009.06674.x.

Escherichia coli DnaA forms helical structures along the longitudinal cell axis distinct from MreB filaments

Affiliations

Escherichia coli DnaA forms helical structures along the longitudinal cell axis distinct from MreB filaments

Kelly Boeneman et al. Mol Microbiol. 2009 May.

Abstract

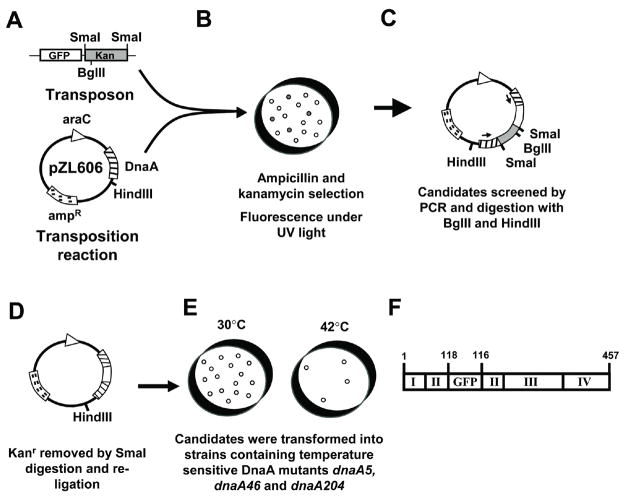
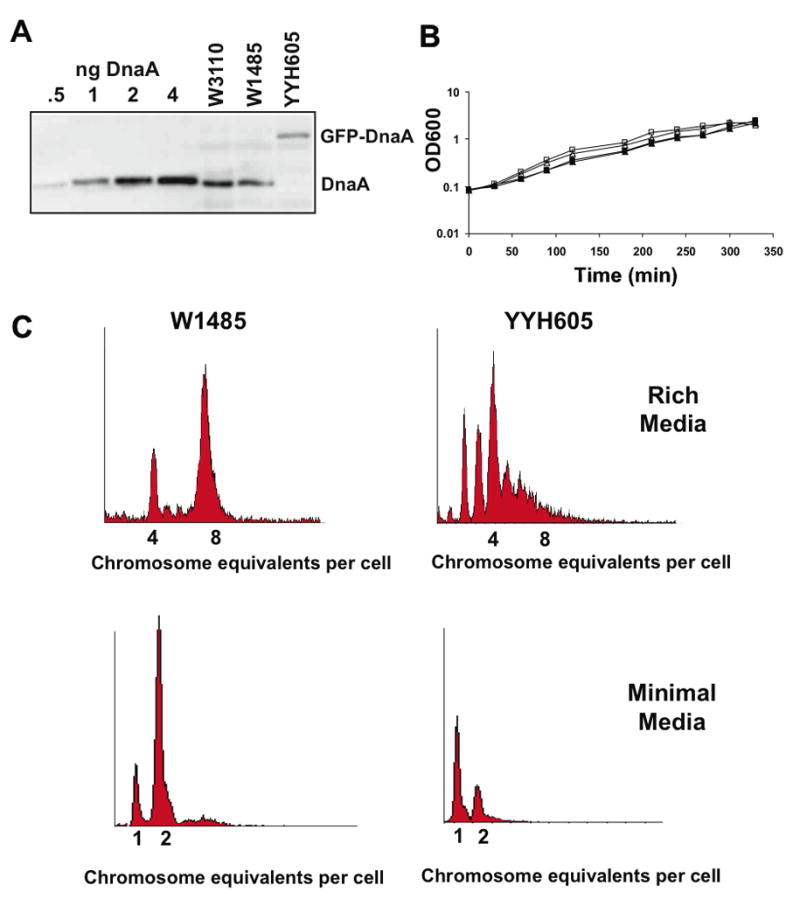
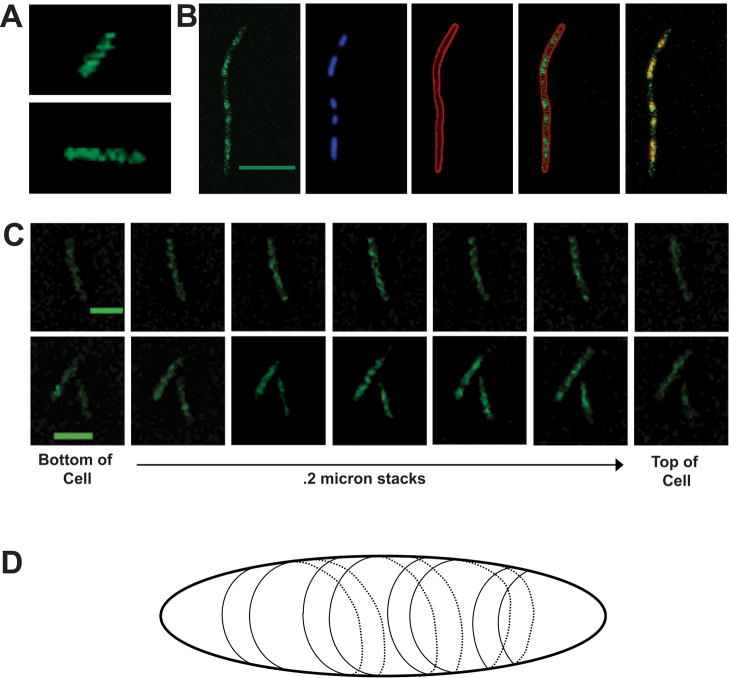
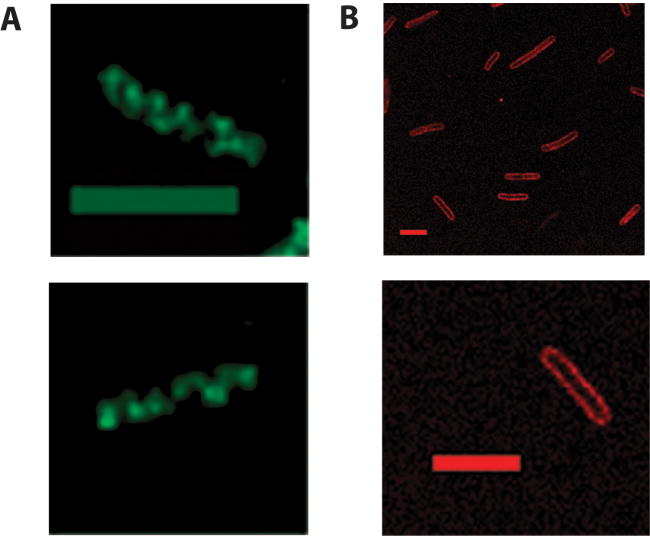
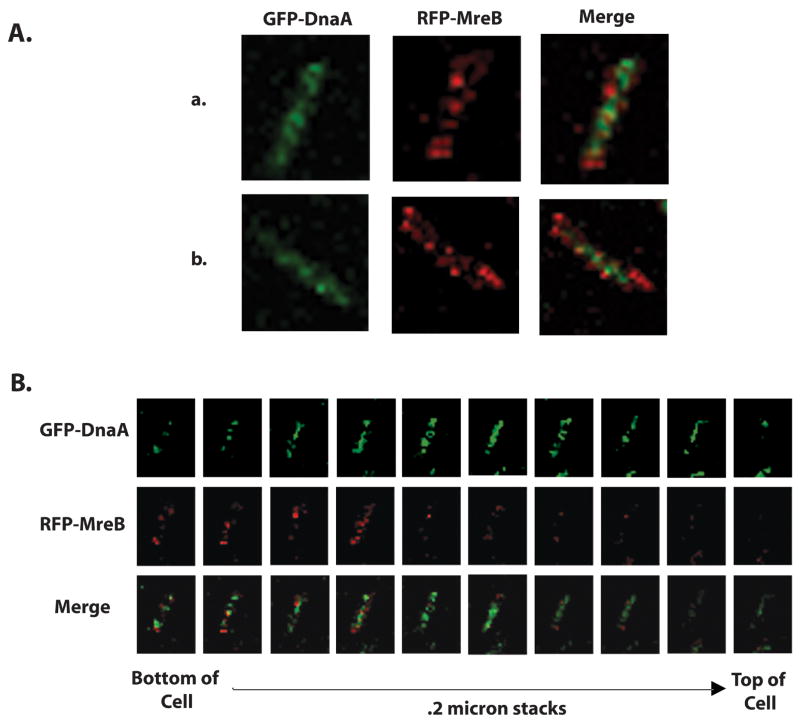
DnaA initiates chromosomal replication in Escherichia coli at a well-regulated time in the cell cycle. To determine how the spatial distribution of DnaA is related to the location of chromosomal replication and other cell cycle events, the localization of DnaA in living cells was visualized by confocal fluorescence microscopy. The gfp gene was randomly inserted into a dnaA-bearing plasmid via in vitro transposition to create a library that included internally GFP-tagged DnaA proteins. The library was screened for the ability to rescue dnaA(ts) mutants, and a candidate gfp-dnaA was used to replace the dnaA gene of wild-type cells. The resulting cells produce close to physiological levels of GFP-DnaA from the endogenous promoter as their only source of DnaA and somewhat under-initiate replication with moderate asynchrony. Visualization of GFP-tagged DnaA in living cells revealed that DnaA adopts a helical pattern that spirals along the long axis of the cell, a pattern also seen in wild-type cells by immunofluorescence with affinity purified anti-DnaA antibody. Although the DnaA helices closely resemble the helices of the actin analogue MreB, co-visualization of GFP-tagged DnaA and RFP-tagged MreB demonstrates that DnaA and MreB adopt discrete helical structures along the length of the longitudinal cell axis.


Figures

Figure 1
Figure 1
Schematic of gfp-dnaA Construction (A–F). (A) The transposons were amplified and moved into DnaA expression plasmid pZL606 by a transposition reaction. (B) Candidate colonies were selected by ampicillin and kanamycin resistance and for fluorescence under UV light illumination. (C) Candidates were then screened for GFP insertion by digestion with BglII and HindIII and by PCR. Arrows denote primer locations. (D) KanR was removed by SmaI digestion and the plasmid was re-ligated. (E) Candidates were selected and screened for DnaA function by rescue experiments with DnaA temperature-sensitive mutants. F) Schematic of the insertion of GFP into DnaA in candidate plasmid pYYH327. GFP follows residue 118 of DnaA, and at the carboxy end of GFP, DnaA resumes beginning with residue 116. This candidate showed the best results in the temperature sensitive rescue assays and was selected for allelic replacement and use in the remainder of this paper.
Figure 2
Figure 2
(A) Immunoblots of total cell protein prepared from wild-type strains (W1485 and WZ52) and a strain containing the gfp-dnaA allele (YYH605) grown at 30°C in LB medium were probed with DnaA anti-serum to detect DnaA and the GFP-tagged DnaA fusion protein. (B) Growth curves of parental strains W1485 (□) and WZ52 (△) and gfp-dnaA expressing strains YYH605 (■) and KB13 (▲) in LB medium at 30°C. (C) Flow cytometry of W1485 and YYH605 cells grown in LB medium (30°C) and in M9 + succinate medium with 0.2% succinate (23°C) and treated with rifampicin and cephalexin prior to analysis.
Figure 3
Figure 3
(A) Confocal fluorescence microscopy Z-stack images of YYH605 cells grown in M9 succinate to an OD600 of 0.3 were analyzed by three dimensional rendering with Fluoview software (v. 5.1). A representative angle from the 3D-rendering is shown here. An animated three dimensional reconstruction is available in the supplemental data. (B) YYH605 cells were treated with cephalexin (10 μg/ml) for approximately three doubling times, FM4-64 (30mM) for 30 min, and chloramphenical (200 μg/ml) and DAPI (1μg/ml) for 10 min prior to collecting Z-stack images by confocal microscopy with the appropriate filters. GFP-DnaA images were deconvolved using Metamorph nearest neighbor analysis. Maximum image projections of z-stacks from all channels are shown. From left to right: GFP-DnaA, DAPI, FM4-64, GFP-DnaA and FM4-64, and GFP-DnaA and DAPI. DAPI has been pseudocolored red in the GFP-DnaA DAPI merged field (right most panel) to allow for easy visualization of both fluorescent components. Calibration bar equals five microns. (C) Field images were deconvolved by Metamorph software and cross sections of individual cells in 0.2 micron increments were examined. Sectional images are shown from the bottom to top of the cell. Calibration bar equals two microns. (D) Schematic of DnaA helices in rod-shaped E. coli cells (not to scale).
Figure 4
Figure 4
(A) Immunofluorescent images of wild-type W3110 cells cultured in LB medium prior fixation and treatment with affinity-purified DnaA antibody and goat-anti-rabbit FITC conjugated secondary antibody. Images of cells are maximum image projections of 0.2 micron stacks taken on Olympus confocal microscope and deconvolved using Metamorph nearest neighbor software. Calibration bar equals 2 microns. (B) Immunofluorescent images of YYH605 cells treated with anti-leader peptidase antiseum and TRITC conjugated secondary antibody. Calibration bar equals 5 microns.
Figure 5
Figure 5
(A) LBK2 cells (YYH605 mreB-rfpsw yhdE::cat) expressing GFP-tagged DnaA and RFP-tagged MreB were grown in M9 + succinate medium to an OD600 of 0.3 and then imaged sequentially through 0.2 micron z-stack slices for GFP and RFP by confocal fluorescence microscopy. Maximum image projections of GFP-DnaA, RFP-MreB and merged images are shown for two representative cells (a and b). (B) Individual 0.2 micron z-stack slices from cell “a” (above) are shown for GFP-DnaA, RFP-MreB, and merged images.

References

    1. Abe Y, Jo T, Matsuda Y, Matsunaga C, Katayama T, Ueda T. Structure and function of DnaA N-terminal domains: specific sites and mechanisms in inter-DnaA interaction and in DnaB helicase loading on oriC. J Biol Chem. 2007;282:17816–17827. - PubMed
    1. Adachi S, Hori K, Hiraga S. Subcellular positioning of F plasmid mediated by dynamic localization of SopA and SopB. J Mol Biol. 2006;356:850–863. - PubMed
    1. Alyahya SA, Alexander R, Costa T, Henriques AO, Emonet T, Jacobs-Wagner C. RodZ, a component of the bacterial core morphogenic apparatus. Proc Natl Acad Sci USA. 2009;106:1239–1244. - PMC - PubMed
    1. Aranovich A, Gdalevsky GY, Cohen-Luria R, Fishov I, Parola AH. Membrane-catalyzed nucleotide exchange on DnaA. Effect of surface molecular crowding. J Biol Chem. 2006;281:12526–12534. - PubMed
    1. Aranovich A, Parola AH, Fishov I. The reactivation of DnaAL366K requires less acidic phospholipids supporting their role in the initiation of chromosome replication in Escherichia coli. FEBS letters. 2007;581:4439–4442. - PubMed

Publication types

MeSH terms