. 2009 May;10(3):403-14.
doi: 10.1111/j.1364-3703.2009.00540.x.

Development of taxon-specific sequence characterized amplified region (SCAR) markers based on actin sequences and DNA amplification fingerprinting (DAF): a case study in the Phoma exigua species complex

Affiliations

Development of taxon-specific sequence characterized amplified region (SCAR) markers based on actin sequences and DNA amplification fingerprinting (DAF): a case study in the Phoma exigua species complex

Maikel M Aveskamp et al. Mol Plant Pathol. 2009 May.

Abstract

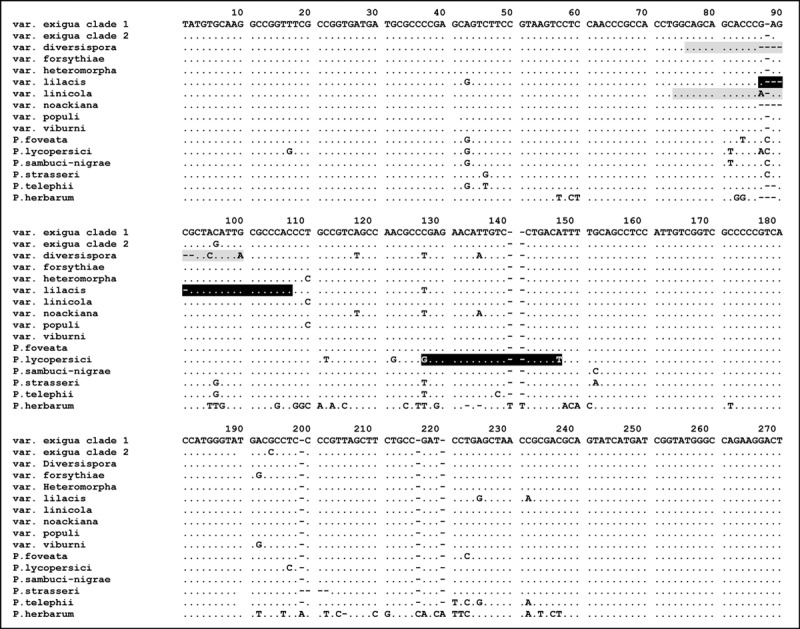
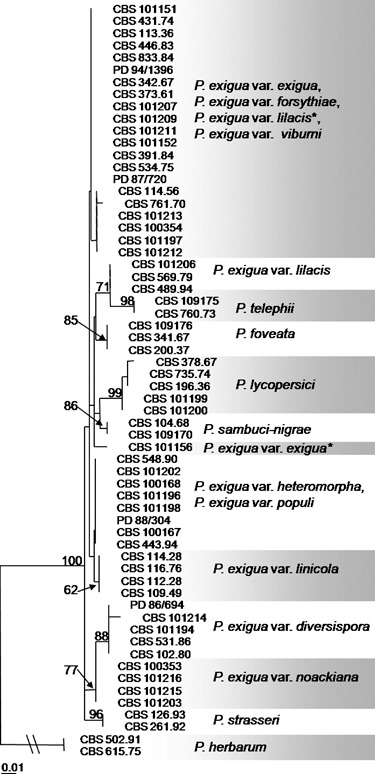
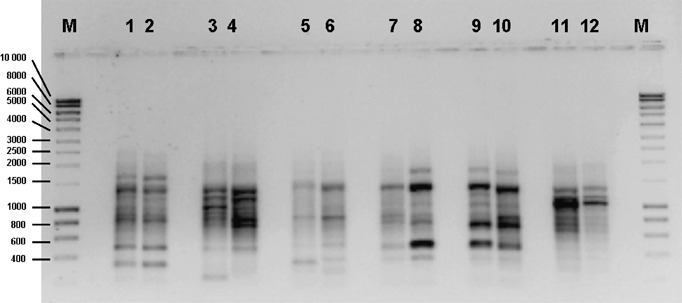
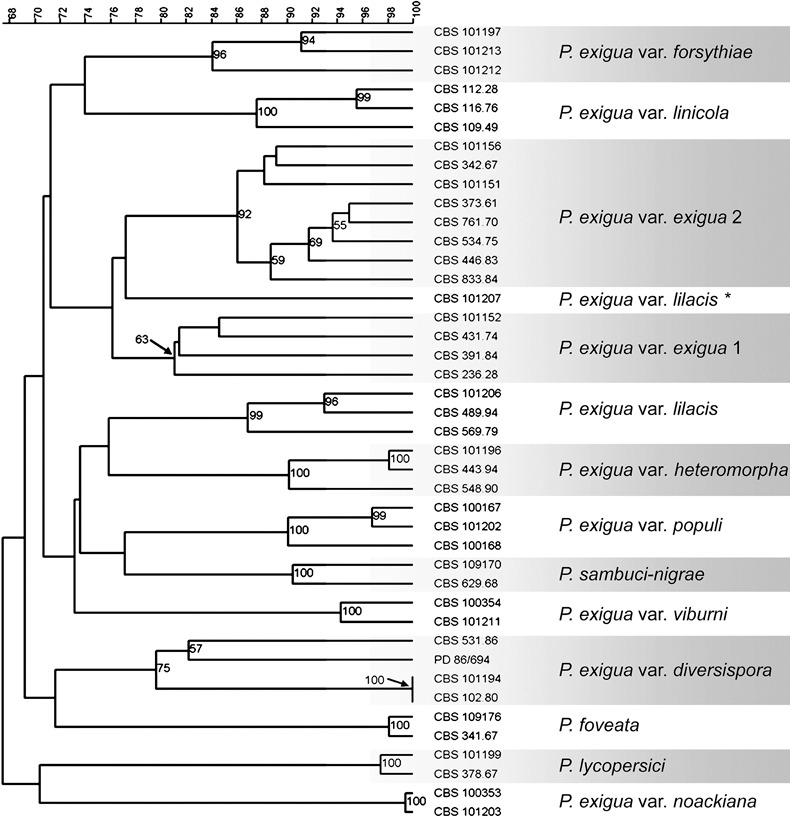
Phoma exigua is considered to be an assemblage of at least nine varieties that are mainly distinguished on the basis of host specificity and pathogenicity. However, these varieties are also reported to be weak pathogens and secondary invaders on non-host tissue. In practice, it is difficult to distinguish P. exigua from its close relatives and to correctly identify isolates up to the variety level, because of their low genetic variation and high morphological similarity. Because of quarantine issues and phytosanitary measures, a robust DNA-based tool is required for accurate and rapid identification of the separate taxa in this species complex. The present study therefore aims to develop such a tool based on unique nucleotide sequence identifiers. More than 60 strains of P. exigua and related species were compared in terms of partial actin gene sequences, or analysed using DNA amplification fingerprinting (DAF) with short, arbitrary, mini-hairpin primers. Fragments in the fingerprint unique to a single taxon were identified, purified and sequenced. Alignment of the sequence data and subsequent primer trials led to the identification of taxon-specific sequence characterized amplified regions (SCARs), and to a set of specific oligonucleotide combinations that can be used to identify these organisms in plant quarantine inspections.


Figures

Figure 1
Figure 1
Alignment of actin sequences of 13 Phoma strains belonging to the P. exigua complex and three outgroup species. Strains included are P. exigua var. exigua (CBS 431.74 and CBS 101156), var. diversispora (CBS 531.86), var. forsythiae (CBS 101213), var. heteromorpha (CBS 443.94), var. lilacis (CBS 569.79), var. linicola (CBS 116.76), var. noackiana (CBS 100353), var. populi (CBS 100167), var. viburni (CBS 100354), P. sambuci‐nigrae (CBS 109170), P. foveata (CBS 341.67), and P. lycopersici (CBS 378.67). As outgroup species, P. strasseri (CBS 261.92), P. telephii (CBS 760.73) and P. herbarum (CBS 615.75) were included. Primers designed for this study are indicated by marked blocks: grey sequence blocks represent a forward primer sequence, black blocks a reverse primer. The full stops indicate characters identical to those in the first line and dashes represent alignment gaps. Primer ACTdiv76F spans var. diversispora nucleotides 76‐100, primer ACTlil103R spans var. lilacis nucleotides 87‐107, primer ACTlin74L spans var. linicola nucleotides 74–90, and primer ACTlyc145R spans P. lycopersici nucleotides 127–147.
Figure 2
Figure 2
Neighbour‐joining phylogenetic tree obtained from partial actin sequences using the HKY85 substitution model (n = 62). Bootstrap support values are based on 1000 replicates and are shown at the nodes when higher than 60%. The scale bar represents 0.01 substitutions per site. The tree is rooted with two strains of P. herbarum (CBS 615.75 and CBS 502.91). The taxa marked with asterisks are considered to be misidentifications in the culture database.
Figure 3
Figure 3
Example of a DAF assay on selected isolates from the P. exigua complex using the H‐CCT primer. Lanes 1 & 2, P. exigua var. heteromorpha CBS 443.94 and CBS 101196. Lanes 3 & 4, P. exigua var. noackiana CBS 100353 and CBS 101203. Lanes 5 & 6, P. exigua var. populi CBS 100167 and CBS 101202. Lanes 7 & 8, P. exigua var. viburni CBS 100354 and CBS 101211. Lanes 9 & 10, P. exigua var. forsythiae CBS 101213 and CBS 101197. Lanes 11 & 12, P. lycopersici CBS 378.67 and CBS 101199. Lanes M, Hyperladder I (Bioline).
Figure 4
Figure 4
UPGMA analysis based on the combination of all five DAF mini‐hairpin patterns using the simple matching binary coefficient to calculate the similarity between the strains. Bootstrap support is based on 1000 replicates and values higher than 50% are shown. The scale at the top indicates percentage similarity. The taxon marked with an asterisk is considered to be a misidentification in the culture database.
Figure 5
Figure 5
PCR Products amplified from genomic DNA using the species‐specific primer combinations indicated below the wells. Lane 1, P. exigua var. exigua (CBS 431.74); Lane 2, idem (CBS 101152); Lane 3, P. foveata (CBS 341.67); Lane 4, idem (CBS 109176); Lane 5, P. lycopersici (CBS 378.67); Lane 6, idem (CBS 101199); Lane 7, P. sambuci‐nigrae (CBS 629.68); Lane 8, idem (CBS 109170); Lane 9, P. exigua var. diversispora (CBS 102.80); Lane 10, idem (CBS 101194); Lane 11, P. exigua var. forsythiae (CBS 101213); Lane 12, idem (CBS 101197); Lane 13, P. exigua var. heteromorpha (CBS 443.94); Lane 14, idem (CBS 101196); Lane 15, P. exigua var. lilacis (CBS 569.79); Lane 16, idem (CBS 101207); Lane 17, P. exigua var. linicola (CBS 116.76) ; Lane 18, idem (CBS 112.28); Lane 19, P. exigua var. noackiana (CBS 100353); Lane 20, idem (CBS 101203); Lane 21, P. exigua var. populi (CBS 100167) ; Lane 22, idem (CBS 101202); Lane 23, P. exigua var. viburni (CBS 100354); Lane 24, idem (CBS 101211). Lane P comprises genomic DNA from pooled isolates from all varieties (CBS 431.74, CBS 341.67, CBS 378.67, CBS 629.68, CBS 102.80, CBS 101213, CBS 101196, CBS 443.94, CBS 569.79, CBS 116.76, CBS 100353, CBS 100167, CBS 100354 and CBS 101156 =P. exigua var. exigua type 2) amplified with the respective primer pairs. Lanes N1–N23 contains the same pooled DNA as in lane P, but excluding the target DNA of the specific applicable primer pair. Lanes M, Hyperladder I (Bioline).

References

    1. Van Der Aa, H.A. , Boerema, G.H. and De Gruyter, J. (2000) Contributions towards a monograph of Phoma (Coelomycetes)—VI. 1. Section Phyllostictoides: Characteristics and nomenclature of its type species Phoma exigua . Persoonia, 17, 435–456.
    1. Abeln, E.C.A. , Stax, A.M. , De Gruyter, J. and Van Der Aa, H.A. (2002) Genetic differentiation of Phoma exigua varieties by means of AFLP fingerprints. Mycol. Res. 106, 419–427.
    1. Álvarez, L.A. , Armengol, J. , Perez‐Sierra, A. , León, M. , Abad‐Campos, P. , Vicent, A. , Beltran, C. and Garcia‐Jiménez, J. (2005) Detección de Phoma exigua var. heteromorpha en viveros de adelfa (Nerium oleander L.) en España. Bol. San. Veg. Plagas, 31, 417–423.
    1. Balis, E. , Velegraki, A. , Fragou, A. , Pefanis, A. , Kalabokas, T. and Mountokalakis, T. (2006) Lung mass caused by Phoma exigua . Scand. J. Infect. Dis. 38, 552–555. - PubMed
    1. Bentley, S. and Bassam, B.J. (1996) A robust DNA amplification fingerprinting system applied to analysis of genetic variation within Fusarium oxysporum f. sp. cubense . J. Phytopathol. 144, 207–213.

Publication types

LinkOut - more resources