

Induction of mast cell accumulation, histamine release and skin edema by N49 phospholipase A2
- PMID: 19400930
- PMCID: PMC2681446
- DOI: 10.1186/1471-2172-10-21
Induction of mast cell accumulation, histamine release and skin edema by N49 phospholipase A2
Abstract
Background: It has been recognized that phospholipase A2 (PLA2) is a crucial component of snake venom, which contributes greatly to snake venom induced inflammation in man. However, the mechanisms through which N49 PLA2 provoke inflammation remain unclear. Recently, a N49 PLA2, TM-N49 from Protobothrops mucrosquamatus crude venom was characterized in our laboratory. Since the purification procedure developed is able to supply us with relatively large quantity of highly purified TM-N49, we investigated the ability of TM-N49 in induction of inflammation.
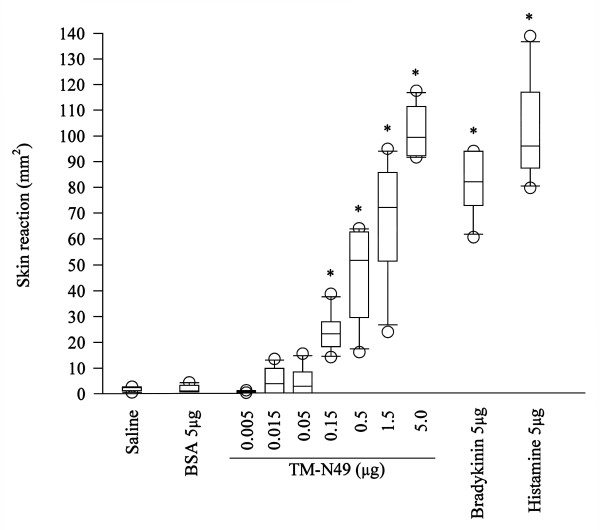
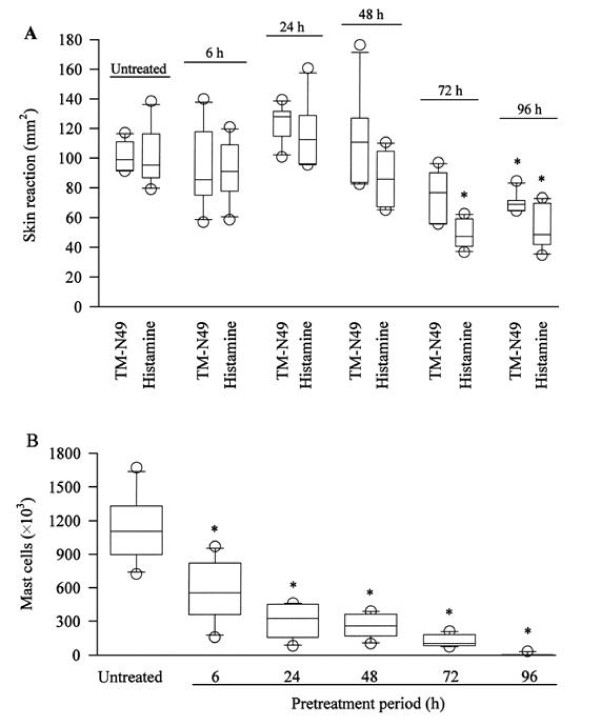
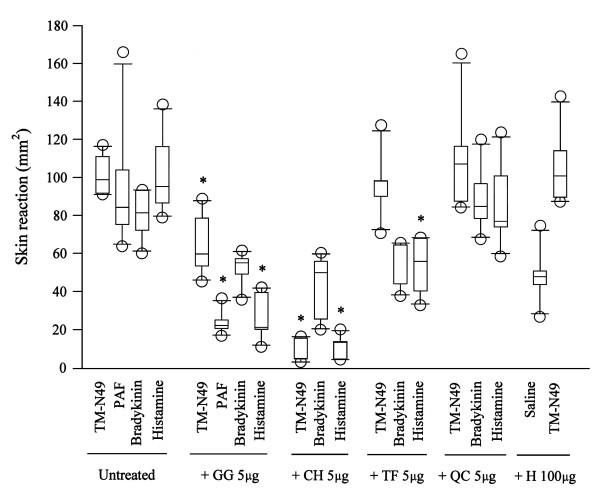
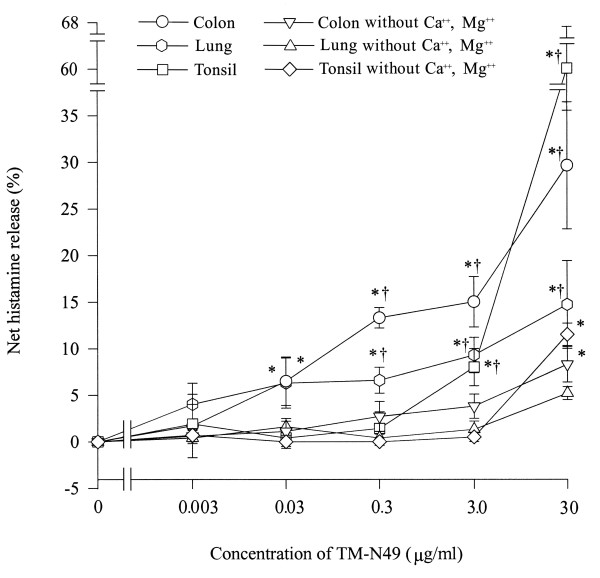
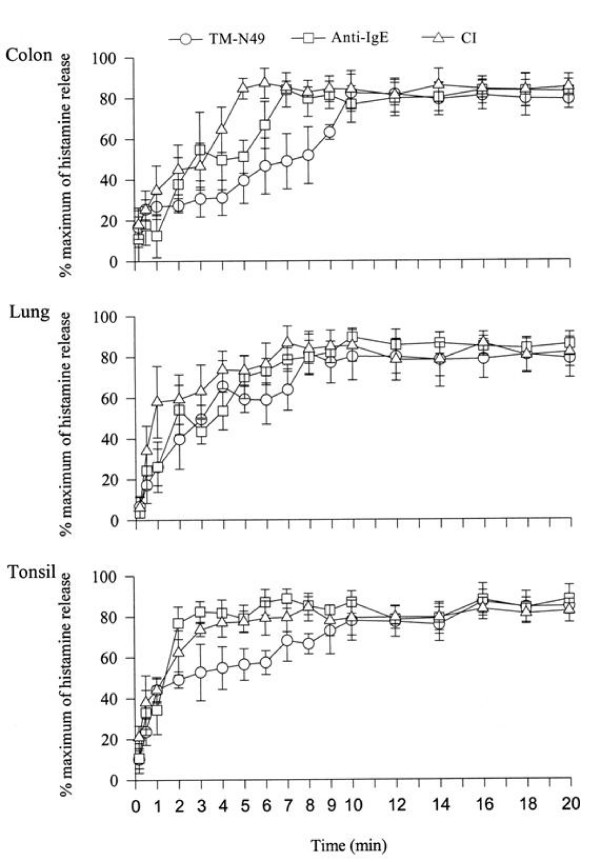
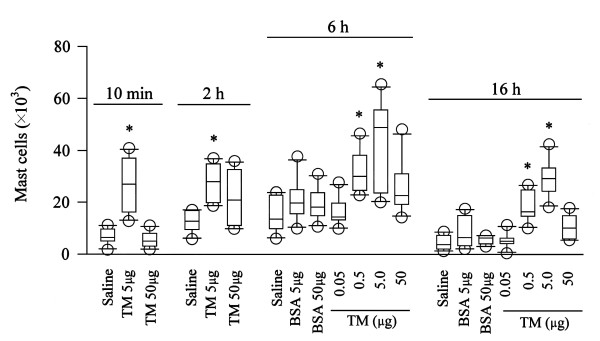
Results: The results showed that TM-N49 provoked a dose dependent increase in microvascular leakage in the skin of rats. The potency of TM-N49 in induction of skin edema appeared similar potency of bradykinin and histamine. Pretreatment of rats with compound 48/80 diminished TM-N49 induced skin reaction and reduced mast cell numbers in rats. Ginkgolide B and cyproheptadine, but not terfenadine and quinacrine, inhibited TM-N49 elicited microvascular leakage when they were co-injected with the stimulus to rat skin. Moreover, TM-N49 was found to induce histamine release from human colon, lung and tonsil mast cells, and both metabolic inhibitors and pertussis toxin were capable of inhibiting TM-N49 elicited histamine release. TM-N49 induced mast cell accumulation in the peritoneum of mice, which was inhibited by co-injection of ginkgolide B, cyproheptadine and terfenadine. Intravenous injection of monoclonal antibodies against CD18, ICAM-1 and CD11a also blocked TM-N49 induced mast cell accumulation.
Conclusion: TM-N49 is a potent stimulus for skin edema, mast cell activation and accumulation.
Figures
Similar articles
-
Induction of mast-cell accumulation by promutoxin, an Arg-49 phospholipase A2.Biomed Res Int. 2013;2013:206061. doi: 10.1155/2013/206061. Epub 2012 Dec 20. Biomed Res Int. 2013. PMID: 23509689 Free PMC article.
-
Induction of inflammatory cell accumulation by TM-N49 and promutoxin, two novel phospholipase A(2).Toxicon. 2010 Sep 15;56(4):580-8. doi: 10.1016/j.toxicon.2010.05.018. Epub 2010 Jun 9. Toxicon. 2010. PMID: 20538012
-
Induction of microvascular leakage and histamine release by promutoxin, an Arg49 phospholipase A2.Toxicon. 2010 Apr 1;55(4):888-96. doi: 10.1016/j.toxicon.2009.12.016. Epub 2009 Dec 28. Toxicon. 2010. PMID: 20036273
-
Edema formation and degranulation of mast cells by a basic phospholipase A2 purified from Trimeresurus mucrosquamatus snake venom.Toxicon. 1989;27(1):115-25. doi: 10.1016/0041-0101(89)90411-x. Toxicon. 1989. PMID: 2469141
-
N49 phospholipase A2, a unique subgroup of snake venom group II phospholipase A2.Biochim Biophys Acta. 2006 Mar;1760(3):462-71. doi: 10.1016/j.bbagen.2005.11.022. Epub 2005 Dec 27. Biochim Biophys Acta. 2006. PMID: 16413680
Cited by
-
Anaphylactic shock caused by haemocoagulase injection in China.Exp Ther Med. 2017 Apr;13(4):1547-1553. doi: 10.3892/etm.2017.4121. Epub 2017 Feb 14. Exp Ther Med. 2017. PMID: 28413507 Free PMC article.
-
Role of endothelial AADC in cardiac synthesis of serotonin and nitrates accumulation.PLoS One. 2012;7(7):e34893. doi: 10.1371/journal.pone.0034893. Epub 2012 Jul 19. PLoS One. 2012. PMID: 22829864 Free PMC article.
-
The Immunogenicity of Hyaluronic Fillers and Its Consequences.Clin Cosmet Investig Dermatol. 2021 Jul 16;14:921-934. doi: 10.2147/CCID.S316352. eCollection 2021. Clin Cosmet Investig Dermatol. 2021. PMID: 34295171 Free PMC article. Review.
-
Venom-based peptide therapy: insights into anti-cancer mechanism.Oncotarget. 2017 Oct 11;8(59):100908-100930. doi: 10.18632/oncotarget.21740. eCollection 2017 Nov 21. Oncotarget. 2017. PMID: 29246030 Free PMC article. Review.
-
Induction of mast-cell accumulation by promutoxin, an Arg-49 phospholipase A2.Biomed Res Int. 2013;2013:206061. doi: 10.1155/2013/206061. Epub 2012 Dec 20. Biomed Res Int. 2013. PMID: 23509689 Free PMC article.
References
-
- Verheij HM. In: Phospholipases in clinical inflammation. Glaser KB, Vadas P, editor. Boca Raton FL: CRC Press; 1996. pp. 3–24.
-
- Dennis EA. In: The enzymes. Boyer PD, editor. New York: Academic Press; 1983. pp. 307–353.
-
- Maraganore JM, Merutka G, Cho W, Welches W, Kézdy FJ, Heinrikson RL. A new class of phospholipases A2 with lysine in place of aspartate 49. Functional consequences for calcium and substrate binding. J Biol Chem. 1984;259:13839–13843. - PubMed
-
- Maraganore JM, Heinrikson RL. The lysine-49 phospholipase A2 from the venom of Agkistrodon piscivorus piscivorus. Relation of structure and function to other phospholipases A2. J Biol Chem. 1986;261:4797–4804. - PubMed
Publication types
MeSH terms
Substances
LinkOut - more resources
Full Text Sources
Medical
Miscellaneous
