

Subsampling effects in neuronal avalanche distributions recorded in vivo
- PMID: 19400967
- PMCID: PMC2697147
- DOI: 10.1186/1471-2202-10-40
Subsampling effects in neuronal avalanche distributions recorded in vivo
Abstract
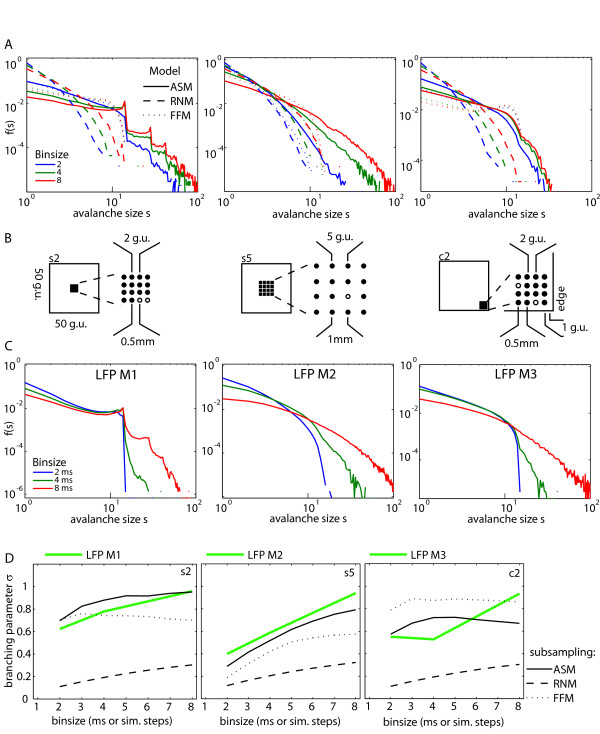
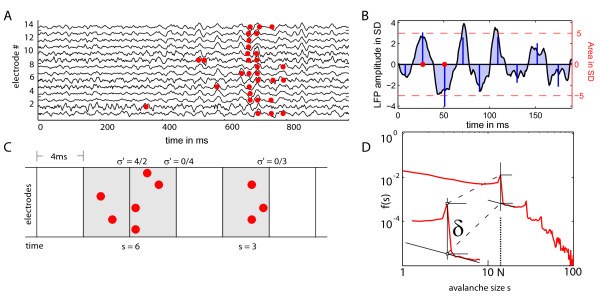
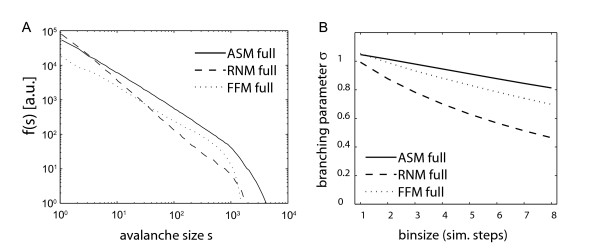
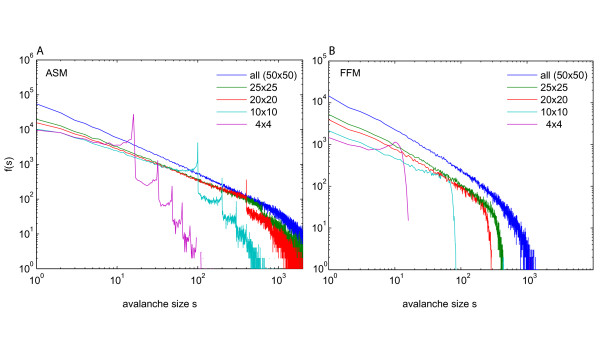
Background: Many systems in nature are characterized by complex behaviour where large cascades of events, or avalanches, unpredictably alternate with periods of little activity. Snow avalanches are an example. Often the size distribution f(s) of a system's avalanches follows a power law, and the branching parameter sigma, the average number of events triggered by a single preceding event, is unity. A power law for f(s), and sigma = 1, are hallmark features of self-organized critical (SOC) systems, and both have been found for neuronal activity in vitro. Therefore, and since SOC systems and neuronal activity both show large variability, long-term stability and memory capabilities, SOC has been proposed to govern neuronal dynamics in vivo. Testing this hypothesis is difficult because neuronal activity is spatially or temporally subsampled, while theories of SOC systems assume full sampling. To close this gap, we investigated how subsampling affects f(s) and sigma by imposing subsampling on three different SOC models. We then compared f(s) and sigma of the subsampled models with those of multielectrode local field potential (LFP) activity recorded in three macaque monkeys performing a short term memory task.
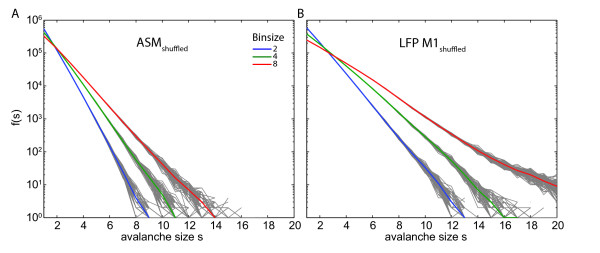
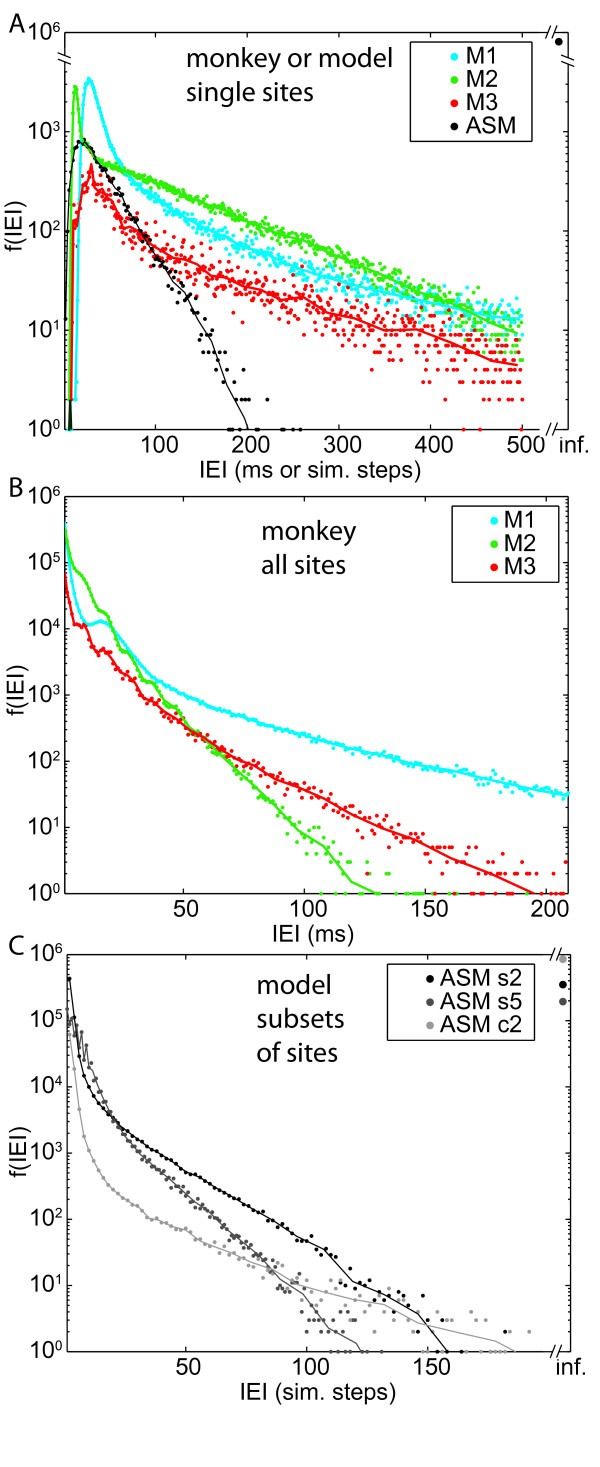
Results: Neither the LFP nor the subsampled SOC models showed a power law for f(s). Both, f(s) and sigma, depended sensitively on the subsampling geometry and the dynamics of the model. Only one of the SOC models, the Abelian Sandpile Model, exhibited f(s) and sigma similar to those calculated from LFP activity.
Conclusion: Since subsampling can prevent the observation of the characteristic power law and sigma in SOC systems, misclassifications of critical systems as sub- or supercritical are possible. Nevertheless, the system specific scaling of f(s) and sigma under subsampling conditions may prove useful to select physiologically motivated models of brain function. Models that better reproduce f(s) and sigma calculated from the physiological recordings may be selected over alternatives.
Figures
Similar articles
-
The recovery of parabolic avalanches in spatially subsampled neuronal networks at criticality.Sci Rep. 2024 Aug 20;14(1):19329. doi: 10.1038/s41598-024-70014-4. Sci Rep. 2024. PMID: 39164334 Free PMC article.
-
Statistical analyses support power law distributions found in neuronal avalanches.PLoS One. 2011;6(5):e19779. doi: 10.1371/journal.pone.0019779. Epub 2011 May 26. PLoS One. 2011. PMID: 21720544 Free PMC article.
-
Neuronal avalanches and time-frequency representations in stimulus-evoked activity.Sci Rep. 2019 Sep 16;9(1):13319. doi: 10.1038/s41598-019-49788-5. Sci Rep. 2019. PMID: 31527749 Free PMC article.
-
A simple growth model constructs critical avalanche networks.Prog Brain Res. 2007;165:13-9. doi: 10.1016/S0079-6123(06)65002-4. Prog Brain Res. 2007. PMID: 17925237 Review.
-
Immunological Avalanches in Renal Immune Diseases.Biomedicines. 2025 Apr 21;13(4):1003. doi: 10.3390/biomedicines13041003. Biomedicines. 2025. PMID: 40299571 Free PMC article. Review.
Cited by
-
Criticality Maximizes Complexity in Neural Tissue.Front Physiol. 2016 Sep 27;7:425. doi: 10.3389/fphys.2016.00425. eCollection 2016. Front Physiol. 2016. PMID: 27729870 Free PMC article.
-
Being critical of criticality in the brain.Front Physiol. 2012 Jun 7;3:163. doi: 10.3389/fphys.2012.00163. eCollection 2012. Front Physiol. 2012. PMID: 22701101 Free PMC article.
-
Self-organized criticality as a fundamental property of neural systems.Front Syst Neurosci. 2014 Sep 23;8:166. doi: 10.3389/fnsys.2014.00166. eCollection 2014. Front Syst Neurosci. 2014. PMID: 25294989 Free PMC article. Review.
-
Neuronal avalanche dynamics indicates different universality classes in neuronal cultures.Sci Rep. 2018 Feb 21;8(1):3417. doi: 10.1038/s41598-018-21730-1. Sci Rep. 2018. PMID: 29467426 Free PMC article.
-
Inferring collective dynamical states from widely unobserved systems.Nat Commun. 2018 Jun 13;9(1):2325. doi: 10.1038/s41467-018-04725-4. Nat Commun. 2018. PMID: 29899335 Free PMC article.
References
-
- Shimono M, Owaki T, Amano K, Kitajo K, Takeda T. Functional modulation of power-law distribution in visual perception. Phys Rev E Stat Nonlin Soft Matter Phys. 2007;75:051902. - PubMed
-
- Freeman WJ. A field-theoretic approach to understanding scale-free neocortical dynamics. Biol Cybern. 2005;92:350–359. - PubMed
MeSH terms
LinkOut - more resources
Full Text Sources
Miscellaneous
