. 2009 Aug;86(2):337-48.
doi: 10.1189/jlb.1208759. Epub 2009 Apr 28.

Zinc transporter ZIP8 (SLC39A8) and zinc influence IFN-gamma expression in activated human T cells

Affiliations

Zinc transporter ZIP8 (SLC39A8) and zinc influence IFN-gamma expression in activated human T cells

Tolunay B Aydemir et al. J Leukoc Biol. 2009 Aug.

Abstract

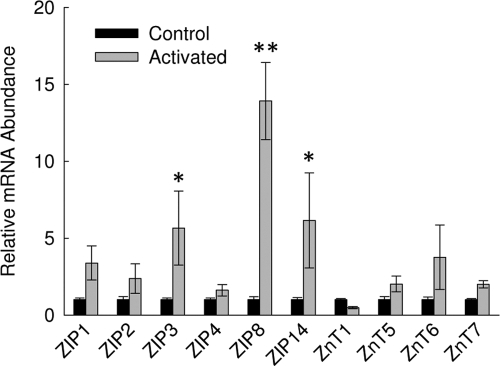
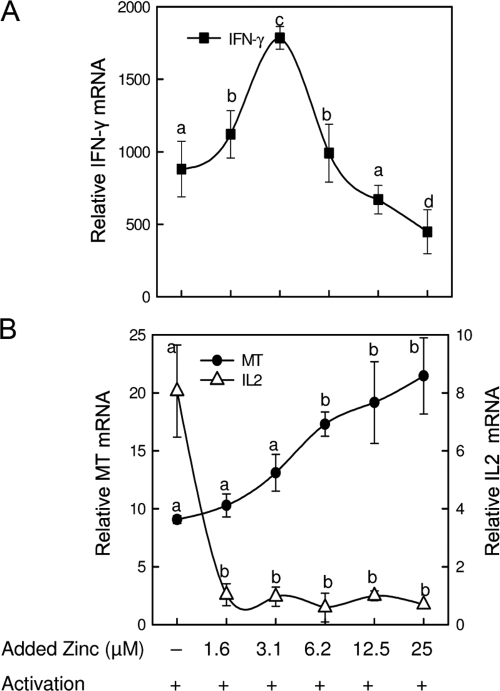
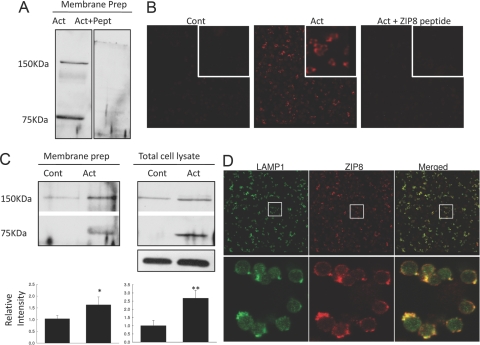
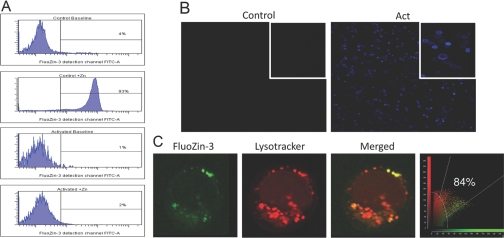
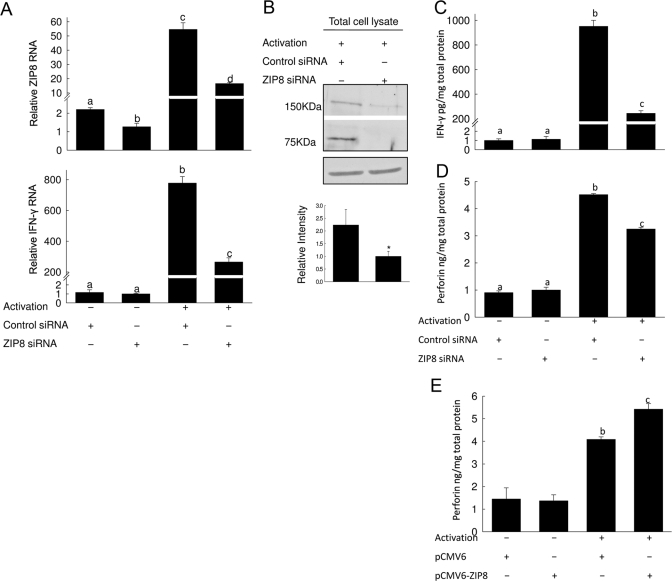
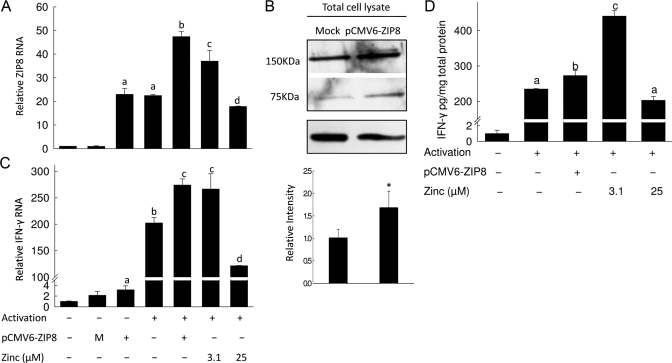
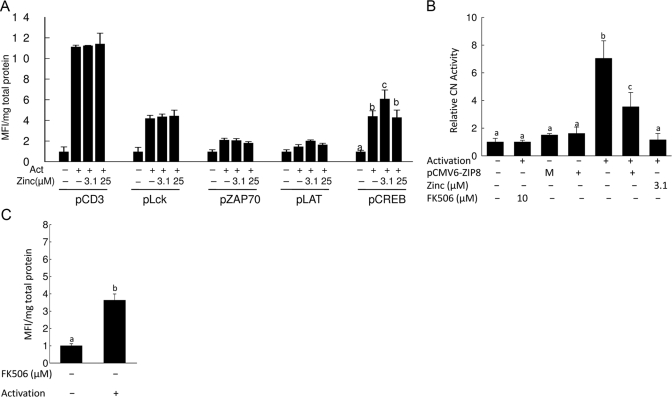
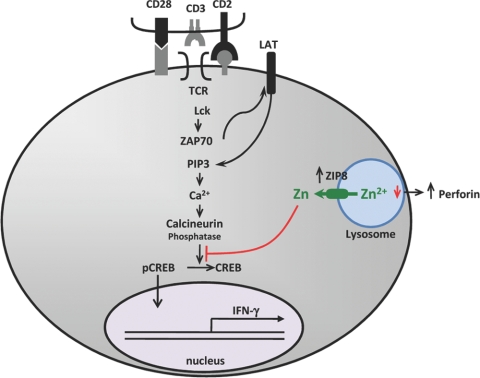
The zinc transporter ZIP8 is highly expressed in T cells derived from human subjects. T cell ZIP8 expression was markedly up-regulated upon in vitro activation. T cells collected from human subjects who had received oral zinc supplementation (15 mg/day) had higher expression of the activation marker IFN-gamma upon in vitro activation, indicating a potentiating effect of zinc on T cell activation. Similarly, in vitro zinc treatment of T cells along with activation resulted in increased IFN-gamma expression with a maximum effect at 3.1 microM. Knockdown of ZIP8 in T cells by siRNA decreased ZIP8 levels in nonactivated and activated cells and concomitantly reduced secretion of IFN-gamma and perforin, both signatures of activation. Overexpression of ZIP8 by transient transfection caused T cells to exhibit enhanced activation. Confocal microscopy established that ZIP8 is localized to the lysosome where ZIP8 abundance is increased upon activation. Loss of lysosomal labile zinc in response to activation was measured by flow cytometry using a zinc fluorophore. Zinc between 0.8 and 3.1 microM reduced CN phosphatase activity. CN was also inhibited by the CN inhibitor FK506 and ZIP8 overexpression. The results suggest that zinc at low concentrations, through inhibition of CN, sustains phosphorylation of the transcription factor CREB, yielding greater IFN-gamma expression in T cells. ZIP8, through control of zinc transport from the lysosome, may provide a secondary level of IFN-gamma regulation in T cells.


Figures

Figure 1.
Figure 1.
Activation of T cells changes zinc transporter expression. Relative ZnT and ZIP transcript levels in total RNA from activated and nonactivated primary human T cells were measured by qPCR. Data are expressed as relative to the nonactivated control and are normalized to 18S rRNA. Representative data are presented. Values shown are means ± sd (n=4). *, P < 0.01; **, P < 0.001, compared with nonactivated control.
Figure 2.
Figure 2.
In vitro zinc addition influences the effect of activation on IFN-γ, MT, and IL-2 expression in primary T cells. Relative mRNA levels of IFN-γ (A) and MT and IL-2 (B) were measured by qPCR in nonactivated and activated cells. The cells were activated after an initial 2-h incubation with the indicated concentration of zinc. Data are normalized to 18S rRNA and are expressed as relative to the nonactivated control that was adjusted to one. Representative data from three independent experiments are presented. Values shown are means ± sd (n=3–4). A different superscript indicates the means are statistically different (P < 0.05–0.001).
Figure 3.
Figure 3.
ZIP8 protein is up-regulated in response to primary T cell activation and localizes with lysosomes. Western blot analysis (A and B) and confocal images (C and D) from primary T cells. Total membrane proteins and total cell lysates were isolated and used for SDS-PAGE. Blots were probed with an affinity-purified polyclonal hZIP8 antibody. (A) Blots were probed with affinity-purified, polyclonal hZIP8, directly or after preincubation with its peptide antigen (Pept). Act, Activated cell. (B) Representative Western blots from three independent experiments for membrane proteins and total cell lysates. The average values of both ZIP8 band intensities from three independent experiments are shown. Values shown are means ± sd (n=6); *, P < 0.02: **, P < 0.001, compared with nonactivated control (Cont). (C) Immunofluororescence localization of ZIP8 (red) by laser-scanning confocal microscopy. Nonactivated and activated primary T cells probed with the ZIP8 antibody. The area in white boxes represents magnified images. (D) Immunofluororescence localization of ZIP8 (red) and LAMP1 (green), a lysosome-specific membrane marker, in activated T cells by laser-scanning confocal microscopy. The area that was chosen for enlarged images was indicated by white squares. Yellow indicates the extent of colocalization.
Figure 4.
Figure 4.
Decrease in intracellular-free zinc in activated primary T cells. FluoZin-3 fluoresence was used to assess labile zinc changes in nonactivated and activated cells. Flow cytometry experiments were conducted in the absence or presence of 100 μM ZnCl2, which was added for 1.5 min (A). Fluorescence intensity (green) was examined by flow cytometry. T cells were activated for 48 h and probed with MT antibody (blue). Images from nonactivated and activated cells were obtained by laser-scanning confocal microscopy. (B) The area in white boxes represents magnified images. Confocal microscopy was used to visualize localization of FluoZin-3 and lysosomes (C). After initial incubation with FluoZin-3, nonactivated T cells were probed with LysoTracker (red), and colocalization (yellow) with free zinc was shown in merged images.
Figure 5.
Figure 5.
ZIP8 knockdown with siRNA decreases IFN-γ and perforin production in activated T cells. After transfection with ZIP8 siRNA or nontargeting random siRNA for 16 h, the T cells were activated for 48 h. Transcript levels of ZIP8 (A) and IFN-γ (C) were measured by qPCR. Representative data from three independent experiments are expressed as relative to nonactivated control and normalized to 18S rRNA. Values shown are means ± sd (n=3). (B) Representative Western blot of total cell lysates from siRNA-transfected, activated T cells. The average values of both ZIP8 band intensities from three independent experiments are shown. Values shown are means ± sd (n=6). (D) Secretion of IFN-γ into the medium was measured by Luminex multicytokine detection. Representative data are expressed as relative to control and were normalized to total protein in the medium. (E and F) Secretion of perforin into the medium was measured by ELISA and normalized to total protein in the medium. Representative data from three independent experiments are shown for measurement of secreted perforin with ZIP8 knockdown (E) or overexpression (F) conditions. Values shown are means ± sd (n=3) in nonactivated cells compared with activated cells and transfected with ZIP8 siRNA or pCMV6-ZIP8. (A, C–F) Bars with a different superscript indicate the means are statistically different (P<0.001–0.003).
Figure 6.
Figure 6.
Overexpression of ZIP8 enhances T cell activation. T cells were activated for 48 h after transfection with pCMV6-ZIP8 or empty vector for 2 h. Transcript levels of ZIP8 (A) and IFN-γ (C) were measured by qPCR. Representative data from three independent experiments are expressed as relative to control and normalized by 18S rRNA. Values shown are means ± sd (n=3); P < 0.01–0.001 compared with ZIP8-transfected, nonactivated cells, indicated by a–d. M, Mock transfection. (B) Representative Western blot of total cell lysates from ZIP8-transfected T cells. The average values of both ZIP8 band intensities from three independent experiments are shown. Values shown are means ± sd (n=6); *, P < 0.001, compared with control. (D) Secretion of IFN-γ into the medium was measured by Luminex multicytokine detection. Representative data are expressed as relative to nontransfected cells and normalized by total protein in the medium. Values shown are means ± sd (n=3); Bars with different superscripts indicate the means are statistically different (P < 0.01–0.001).
Figure 7.
Figure 7.
Zinc enhances CREB phosphorylation via inhibiting CN activity. Phosphorylation of indicated proteins in the TCR signaling pathway was measured by Luminex phosphoprotein detection (A and C). T cells were activated for 48 h after an initial 2-h incubation with the indicated concentrations of zinc (A) or CN inhibitor FK506 (C). Representative data from three independent experiments are expressed as relative to control and normalized by total input protein in the cell lysate. Values shown are means ± sd (n=3); P < 0.001 compared with nonactivated cells, indicated by a–c. p, Phospho. (B) Representative data from three independent experiments for cellular CN activity assays are shown. Activity of CN was determined spectrophotometrically based on phosphate release from the substrate. Cell cytosol was obtained from lysates by ultracentrifugation and used for detection of cellular CN activity. Lysate was incubated with the indicated concentration of zinc or CN inhibitor FK506 for 10 min prior to addition of substrate. Values shown are means ± sd (n=3); Bars with different superscripts indicate the means are statistically different (P < 0.01–0.001).
Figure 8.
Figure 8.
Antigen presentation activates T cells via signaling pathways that increase IFN-γ production. Zinc potentiates this response through increased production of ZIP8 that exports lysosomal zinc, which increases cytoplasmic zinc, inhibits CN, and leads to increased IFN-γ expression via increased CREB phosphorylation. PIP3, Phosphatidylinositol (3,4,5)trisphosphate.

References

    1. Liuzzi J P, Cousins R J. Mammalian zinc transporters. Annu Rev Nutr. 2004;24:151–172. - PubMed
    1. Eide D J. Zinc transporters and the cellular trafficking of zinc. Biochim Biophys Acta. 2006;1763:711–722. - PubMed
    1. Rink L, Haase H. Zinc homeostasis and immunity. Trends Immunol. 2007;28:1–4. - PubMed
    1. Haase H, Rink L. Signal transduction in monocytes: the role of zinc ions. Biometals. 2007;20:579–585. - PubMed
    1. Beck F, Prasad A, Kaplan J, Fitzgerald J, Brewer G. Changes in cytokine production and T cell subpopulations in experimentally induced zinc deficient humans. Am J Physiol. 1997;272:E1002–E1007. - PubMed

Publication types

MeSH terms