. 2009 Sep;86(3):491-504.
doi: 10.1189/jlb.1208728. Epub 2009 Apr 28.

Lethal pulmonary infection with Francisella novicida is associated with severe sepsis

Affiliations

Lethal pulmonary infection with Francisella novicida is associated with severe sepsis

Jyotika Sharma et al. J Leukoc Biol. 2009 Sep.

Abstract

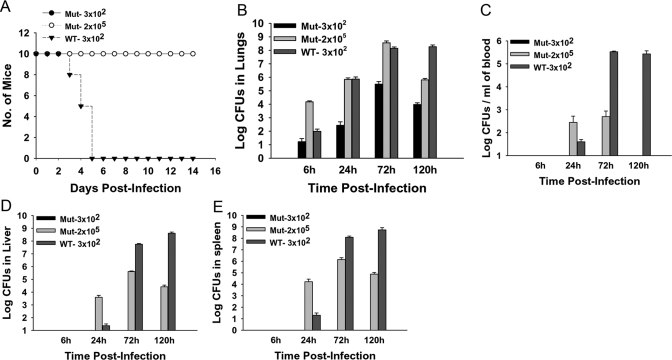
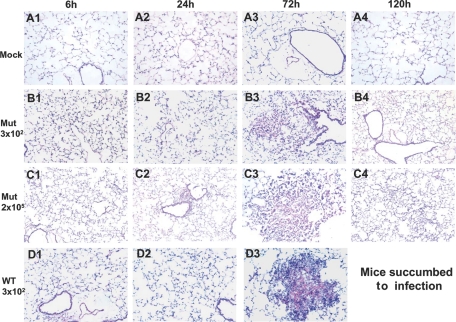
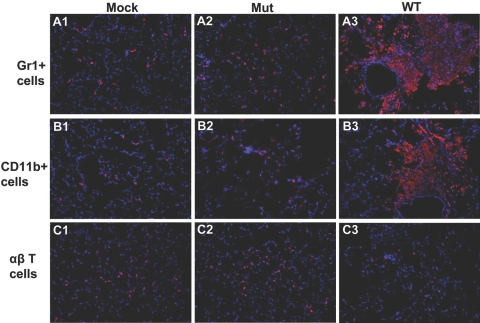
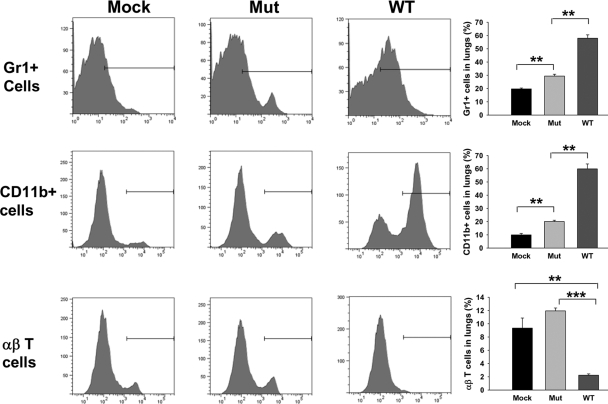
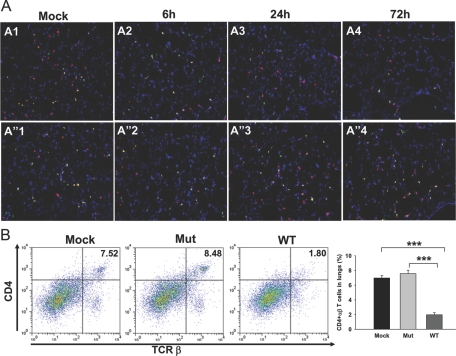
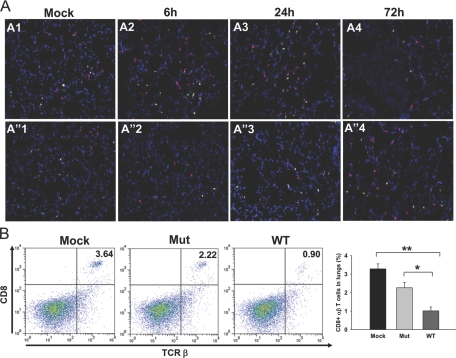
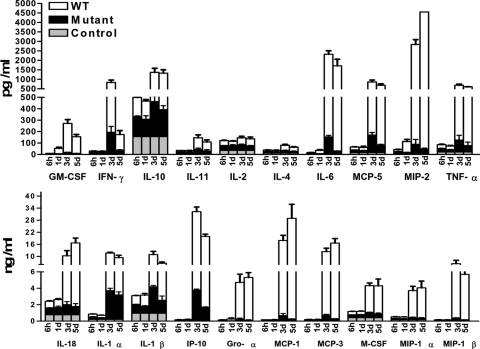
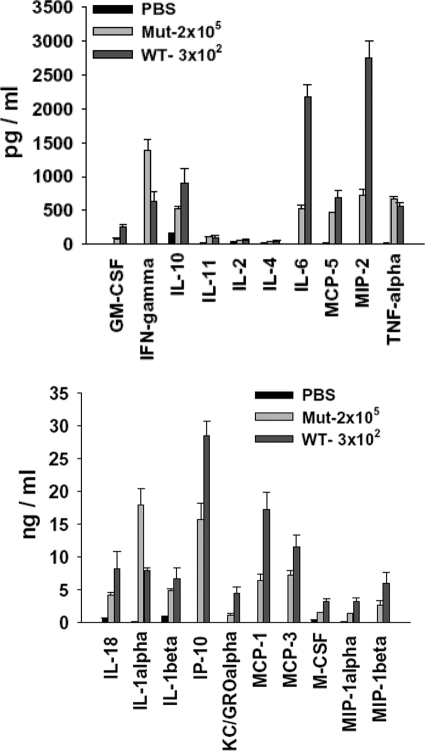
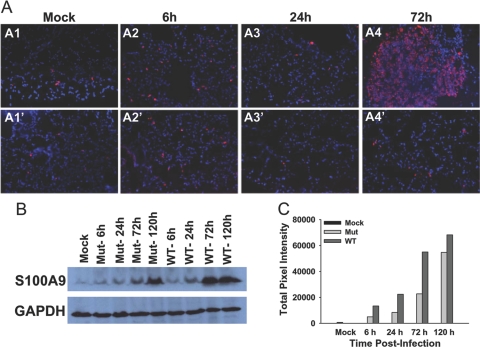
The bacterial or host determinants of lethality associated with respiratory Francisella infections are currently unknown. No exo- or endotoxins that contribute to the severity of this disease have been identified. However, a deregulated host immune response upon infection is characterized by an initial 36- to 48-h delay followed by a rapid and excessive inflammatory response prior to death at 72-120 h. Here, we extend these findings by comparing host immune responses between sublethal and lethal respiratory infections of mice with an attenuated transposon mutant (Mut) of F. novicida (F.n.) strain U112 (sublethal) versus the wild-type (WT) strain (lethal). Infection with WT bacteria, but not the Mut, was characterized by sustained bacteremia and systemic dissemination of the pathogen with temporal increases in bacterial burdens in liver and spleen. Severe pathology with large foci of infiltrates associated with extensive tissue damage was evident in WT-infected lungs, and Mut-infected mice displayed much reduced pathology with intact lung architecture. Similar to other experimental models of severe sepsis, WT- but not the Mut-infected mice exhibited a robust increase in numbers of Gr1+ and CD11b+ cells, while displaying a significant depletion of alphabeta T cells. Further, a dramatic up-regulation of multiple cytokines and chemokines was observed only in lethal WT infection. In addition, an earlier and larger increased expression of S100A9, a known mediator of sepsis, was observed in WT-infected mice. Taken together, these results show that a hyperinflammatory host immune response, culminating in severe sepsis, is responsible for the lethal outcome of respiratory tularemia.


Figures

Figure 1.
Figure 1.
The 58-kDa mutant is highly attenuated in vivo. Mice were inoculated intranasally with 3 × 10² CFUs of the WT or 3 × 10² or 2 × 10⁵ CFUs of Mut bacteria in 20 μl PBS. Mock control mice received 20 μl PBS alone. (A) Survival of the mice was recorded daily over a period of 3 weeks. WT-infected mice showed disease symptoms by 72 h and became moribund and succumbed to infection by 120 h p.i., whereas mutant-infected mice remained healthy throughout the infection period; n = 10/group for this representative of three experiments. (B) Bacterial burden was enumerated in lungs harvested from Mut- and WT-infected mice at 6, 24, 72, and 120 h p.i. Mice infected with 3 × 10² CFUs of the Mut bacteria displayed lower bacterial loads than those infected with similar doses of the WT bacteria at all times p.i.-tested. Bacterial loads in mice infected with 2 × 10⁵ CFUs of Mut bacteria were higher than WT-infected mice at 6, 24, and 72 h p.i. By 120 h p.i., the bacterial burden was reduced in Mut-infected mice, whereas it remained high in WT-infected mice at that time; n = 3–5/group. A Representative of three independent experiments is shown. Bacterial burden in (C) blood, (D) liver, and (E) spleen of mice infected with 3 × 10² CFUs of WT or 2 × 10⁵ CFUs of Mut bacteria. No bacterial loads were detected in these organs from mice infected with 3 × 10² CFUs of Mut bacteria. n = 3–5/group. A Representative of three independent experiments is shown.
Figure 2.
Figure 2.
The Mut-infected mice lungs display reduced pathology. Mice were infected intranasally with 3 × 10² CFUs of the WT or 3 × 10² or 2 × 10⁵ CFUs of Mut bacteria in 20 μl PBS. Mock control mice received 20 μl PBS alone. At 6, 24, 72, and 120 h p.i., the lungs of mice were isolated, sectioned, and stained with H&E. (A1–A4) Representative sections from lungs of mock mice at 6, 24, 72, and 120 h p.i., respectively. (B1–B4) Representative lung sections from mice infected with 3 × 10² CFUs of Mut at 6, 24, 72, and 120 h p.i. (C1–C4) Representative lung sections of mice infected with 2 × 10⁵ CFUs of Mut at 6, 24, 72, and 120 h p.i. (D1–D3) Representative lung sections of mice infected with 3 × 10² CFUs of WT at 6, 24, and 72 h p.i. Data are from one representative experiment of three performed (n=3 for each group/experiment). Original magnification, ×200.
Figure 3.
Figure 3.
Cellular infiltration in lungs of mice infected with the mutant is altered. Mice were infected intranasally with 3 × 10² CFUs of the WT or Mut bacteria in 20 μl PBS. Mock control mice received 20 μl PBS alone. At 72 h p.i., the lungs from mice were isolated and sectioned, and in situ IF staining was performed. (A1–A3) A purified rat anti-mouse Gr1 mAb (clone Ly-6G) and a RRX-conjugated Affipure goat anti-rat IgG were used to visualize the PMN cells. A1 represents Gr1+ cells in mock control mice; A2 shows the Gr1+ staining in Mut-infected mice, and A3 shows staining of Gr1+ cells in WT-infected mice. (B1–B3) CD11b+ myeloid cells (red) were visualized using an R-PE-conjugated CD11b mAb. B1 shows CD11b+ cells in mock lung; B2 and B3 represent CD11b+ staining in Mut- and WT-infected lungs, respectively. (C1–C3) R-PE-conjugated anti-mouse αβ TCR-β chain mAb was used to stain αβ T cells (red). C1 displays αβ T cells in mock animals, and C2 and C3 represent αβ T cell staining in Mut- and WT-infected mice lungs, respectively. Nuclei (blue) were stained with 4′6′-diamidino-2-phenylindole-dilactate. Images are from one representative experiment of three performed (n=3–4 mice/group for each experiment). Original magnification, ×200.
Figure 4.
Figure 4.
Flow cytometry analysis of cellular infiltrates in Mut- and WT-infected lungs. Lung cells were isolated by collagenase treatment from mock control mice and mice infected intranasally with 3 × 10² CFUs of the WT or Mut bacteria at 72 h p.i. The cells were stained with (top row) anti-Gr1-APC; (middle row) anti-CD11b-PE, or (bottom row) anti-αβ TCR-β chain-PE. Appropriate isotype-matched negative controls were used to set the gates. The positively stained cells were expressed as percent of total lung cell population. Total number of lung cells (×106) in this representative experiment was 6.66 ± 0.88 in mock, 7.5 ± 2.84 in Mut-infected, and 10.66 ± 1.33 in WT-infected animals. An average of percent positive cells from three mice from a representative of three experiments is shown. **, P < 0.005; ***, P < 0.0001.
Figure 5.
Figure 5.
CD4+ αβ T cells are depleted from WT-infected mice lungs. (A) In situ IF staining was performed on frozen lung sections from mock control or mice infected intranasally with 3 × 10² CFUs of the WT or Mut bacteria at 72 h p.i. The sections were stained with anti-αβ TCR-β chain-PE (red) and anti-CD4 followed by Alexa-488-conjugated secondary antibody (green). A1 and A”1 represent mock control mice. A2–A4 are lungs from mice infected with WT at 6, 24, and 72 h p.i., respectively. A”2–A”4 represent lungs from Mut-infected mice at 6, 24, and 72 h p.i., respectively. Representative images from two independent experiments, each with three to four mice/group, are shown. Original magnification, ×100. (B) Lung cells from mock and Mut- and WT-infected mice were analyzed for CD4+ αβ T cells by FACS at 72 h p.i. The cells were stained simultaneously with anti-αβ TCR-β chain-PE and anti-CD4-APC-Cy7. Lung cells stained singly for the αβ TCR-β chain or CD4 were used to set the gates. The double-positive cells are expressed as percent of total lung cell population. Total number of lung cells (×106) in this representative experiment was 5.70 ± 1.27 in mock, 8.7 ± 0.76 in Mut-infected, and 11.83 ± 0.49 in WT-infected animals. An average of percent positive cells from three mice from a representative of two experiments is shown. ***, P < 0.0001.
Figure 6.
Figure 6.
Infiltration of CD8+ T cells in lungs after infection with Mut or WT bacteria. In situ IF staining was performed on frozen lung sections from mock control or mice infected intranasally with 3 × 10² CFUs of the WT or Mut bacteria at 72 h p.i. The sections were stained with anti-αβ TCR-β chain-PE (red) and anti-CD8 followed by Alexa-488-conjugated secondary antibody (green). (A, A1 and A”1) Mock control mice. (A, A2–A4) Lungs from mice infected with WT at 6, 24, and 72 h p.i., respectively. (A, A”2–A”4) Lungs from Mut-infected mice at 6, 24, and 72 h p.i., respectively. Representative images are from two independent experiments, each with three to four mice. Original magnification, ×200. (B) Lung cells from mock and Mut- and WT-infected mice were analyzed for CD8+ αβ T cells by FACS at 72 h p.i. The cells were stained simultaneously with anti-αβ TCR-β chain-PE and anti-CD8-Alexa-647. Lung cells stained singly for αβ TCR-β chain or CD8 were used to set the gates. The double-positive cells are expressed as percent of total lung cell population. Total number of lung cells (×106) in this representative experiment was 5.70 ± 1.27 in mock, 8.7 ± 0.76 in Mut-infected, and 11.83 ± 0.49 in WT-infected animals. An average of percent positive cells from three mice from a representative of two experiments is shown. *, P <0.05; **, P < 0.005.
Figure 7.
Figure 7.
Hypercytokinemia is absent from lungs of Mut-infected mice. The lungs from mock control and mice infected intranasally with 3 × 10² CFUs of Mut or WT bacteria were harvested at 6 h, 1 day, 3 days, and 5 days p.i., homogenized in PBS with protease inhibitors, and analyzed for rodent multi-analyte profile (Rules-Based Medicine). Results shown are average of three infected and mock control mice from two to three independent experiments.
Figure 8.
Figure 8.
Bacterial load in lungs does not contribute to the absence of hypercytokinemia in Mut-infected mice. The lungs from mice infected with 2 × 10⁵ CFUs of Mut or 3 × 10² CFUs of WT bacteria were harvested at 72 h p.i., homogenized, and analyzed for rodent multi-analyte profile (Rules-Based Medicine). Results shown are average of three infected mice from two independent experiments for Mut and three independent experiments for WT.
Figure 9.
Figure 9.
S100A9 expression is up-regulated in the lungs of WT-infected mice. (A) S100A9 expression was assessed using in situ IF staining of lung sections from mice infected with 3 × 10² CFUs of Mut or WT bacteria. (A1–A4) A1 depicts S100A9 expression in mock control; A2–A4 represent images of WT-infected lungs at 6, 24, and 72 h p.i., respectively. (A1’–A4’) A1’ shows S100A9 expression in mock lung; A2’–A4’ show Mut-infected lungs at 6, 24, and 72 h p.i., respectively. Images are from one representative experiment of two performed (n=3–4 mice/group). Original magnification, ×200. (B) Lung homogenates from mock control (Lane 1) and from mice infected with 3 × 10² CFUs of Mut at 6, 24, 72, and 120 h p.i. (Lanes 2–5, respectively) or WT bacteria (Lanes 6–9) were run on polyacrylamide gels, transferred to PVDF membranes, and probed with anti-S100A9 antibody. Immunoblotting with anti-GAPDH antibody was performed to monitor equal loading of samples. Data represent at least three independent experiments. (C) A plot of total pixel intensity of the S100A9 band in each lane of one representative blot is depicted. The pixel intensities were quantified using IPLab 4.0 imaging software.

Comment in

References

    1. Dennis D T, Inglesby T V, Henderson D A, Bartlett J G, Ascher M S, Eitzen E, Fine A D, Friedlander A M, Hauer J, Layton M, Lillibridge S R, McDade J E, Osterholm M T, O'Toole T, Parker G, Perl T M, Russell P K, Tonat K, Working Group on Civilian Biodefense Tularemia as a biological weapon: medical and public health management. JAMA. 2001;285:2763–2773. - PubMed
    1. McLendon M K, Apicella M A, Allen L A. Francisella tularensis: taxonomy, genetics, and immunopathogenesis of a potential agent of biowarfare. Annu Rev Microbiol. 2006;60:167–185. - PMC - PubMed
    1. Sjostedt A. Tularemia: history, epidemiology, pathogen physiology, and clinical manifestations. Ann N Y Acad Sci. 2007;1105:1–29. - PubMed
    1. Mares C A, Ojeda S S, Morris E G, Li Q, Teale J M. Initial delay in the immune response to Francisella tularensis is followed by hypercytokinemia characteristic of severe sepsis and correlating with upregulation and release of damage-associated molecular patterns. Infect Immun. 2008;76:3001–3010. - PMC - PubMed
    1. Mohapatra N P, Soni S, Reilly T J, Liu J, Klose K E, Gunn J S. Combined deletion of four Francisella novicida acid phosphatases attenuates virulence and macrophage vacuolar escape. Infect Immun. 2008;76:3690–3699. - PMC - PubMed

Publication types

MeSH terms