

Confirmation of multiple risk Loci and genetic impacts by a genome-wide association study of type 2 diabetes in the Japanese population
- PMID: 19401414
- PMCID: PMC2699880
- DOI: 10.2337/db08-1494
Confirmation of multiple risk Loci and genetic impacts by a genome-wide association study of type 2 diabetes in the Japanese population
Abstract
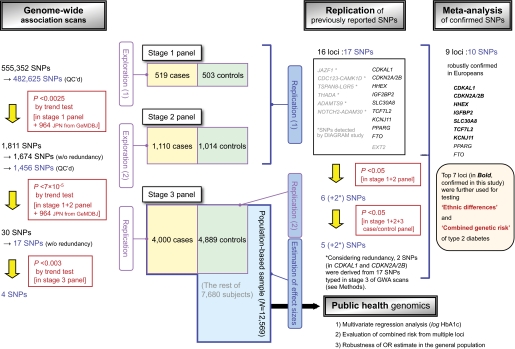
Objective: To identify novel type 2 diabetes gene variants and confirm previously identified ones, a three-staged genome-wide association study was performed in the Japanese population.
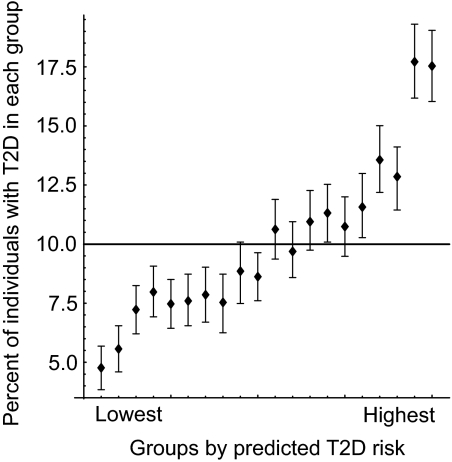
Research design and methods: In the stage 1 scan, we genotyped 519 case and 503 control subjects with 482,625 single nucleotide polymorphism (SNP) markers; in the stage 2 panel comprising 1,110 case subjects and 1,014 control subjects, we assessed 1,456 SNPs (P < 0.0025, stage 1); additionally to direct genotyping, 964 healthy control subjects formed the in silico control panel. Along with genome-wide exploration, we aimed to replicate the disease association of 17 SNPs from 16 candidate loci previously identified in Europeans. The associated and/or replicated loci (23 SNPs; P < 7 x 10(-5) for genome-wide exploration and P < 0.05 for replication) were examined in the stage 3 panel comprising 4,000 case subjects and 12,569 population-based samples, from which 4,889 nondiabetic control subjects were preselected. The 12,569 subjects were used for overall risk assessment in the general population.
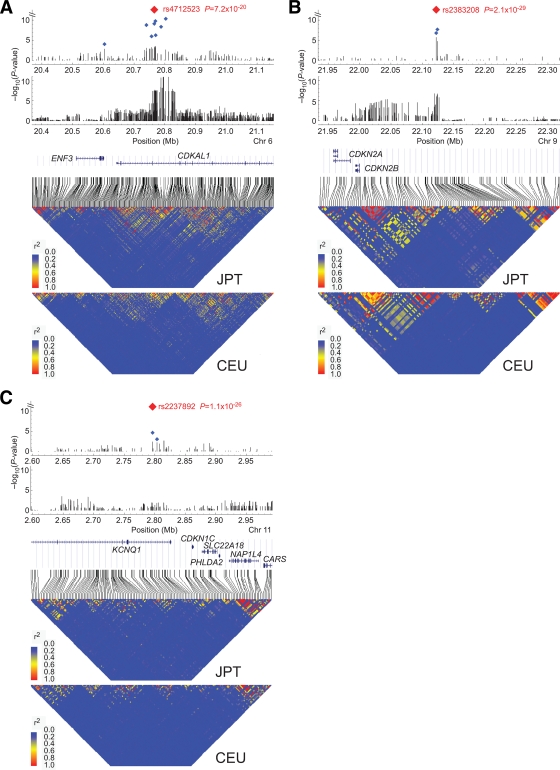
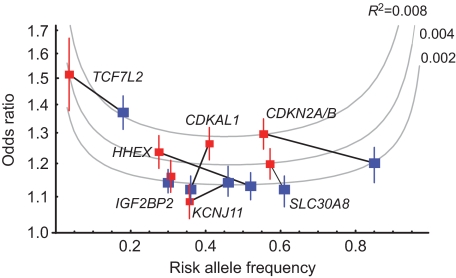
Results: Four loci-1 novel with suggestive evidence (PEPD on 19q13, P = 1.4 x 10(-5)) and three previously reported-were identified; the association of CDKAL1, CDKN2A/CDKN2B, and KCNQ1 were confirmed (P < 10(-19)). Moreover, significant associations were replicated in five other candidate loci: TCF7L2, IGF2BP2, SLC30A8, HHEX, and KCNJ11. There was substantial overlap of type 2 diabetes susceptibility genes between the two populations, whereas effect size and explained variance tended to be higher in the Japanese population.
Conclusions: The strength of association was more prominent in the Japanese population than in Europeans for more than half of the confirmed type 2 diabetes loci.
Figures
References
-
- Ehtisham S, Crabtree N, Clark P, Shaw N, Barrett T: Ethnic differences in insulin resistance and body composition in United Kingdom adolescents. J Clin Endocrinol Metab 2005; 90: 3963– 3969 - PubMed
-
- Wong J, Molyneaux L, Zhao D, Constantino M, Gray RS, Twigg SM, Xu ZR, Yue DK: Different accelerators to early-onset type 2 diabetes: a comparison of Anglo-Celtic and Chinese patients. J Diabetes Complications 2008; 22: 389– 394 - PubMed
-
- Stevens J, Truesdale KP, Katz EG, Cai J: Impact of body mass index on incident hypertension and diabetes in Chinese Asians, American whites, and American blacks: the People's Republic of China Study and the Atherosclerosis Risk in Communities Study. Am J Epidemiol 2008; 167: 1365– 1374 - PMC - PubMed
-
- Fukushima M, Usami M, Ikeda M, Nakai Y, Taniguchi A, Matsuura T, Suzuki H, Kurose T, Yamada Y, Seino Y: Insulin secretion and insulin sensitivity at different stages of glucose tolerance: a cross-sectional study of Japanese type 2 diabetes. Metabolism 2004; 53: 831– 835 - PubMed
-
- Nakanishi S, Okubo M, Yoneda M, Jitsuiki K, Yamane K, Kohno N: A comparison between Japanese-Americans living in Hawaii and Los Angeles and native Japanese: the impact of lifestyle westernization on diabetes mellitus. Biomed Pharmacother 2004; 58: 571– 577 - PubMed
Publication types
MeSH terms
Substances
LinkOut - more resources
Full Text Sources
Medical
Miscellaneous
