. 2009 Jul;58(7):1558-67.
doi: 10.2337/db09-0033. Epub 2009 Apr 28.

Macrophages and adipocytes in human obesity: adipose tissue gene expression and insulin sensitivity during calorie restriction and weight stabilization

Affiliations

Macrophages and adipocytes in human obesity: adipose tissue gene expression and insulin sensitivity during calorie restriction and weight stabilization

Frédéric Capel et al. Diabetes. 2009 Jul.

Abstract

Objective: We investigated the regulation of adipose tissue gene expression during different phases of a dietary weight loss program and its relation with insulin sensitivity.

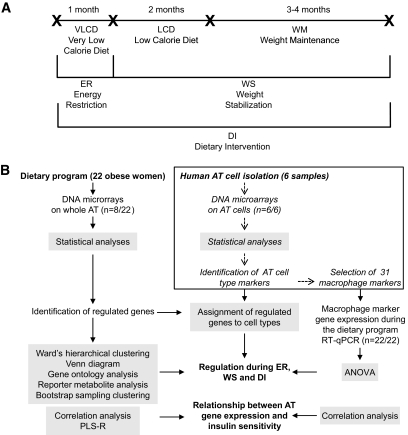
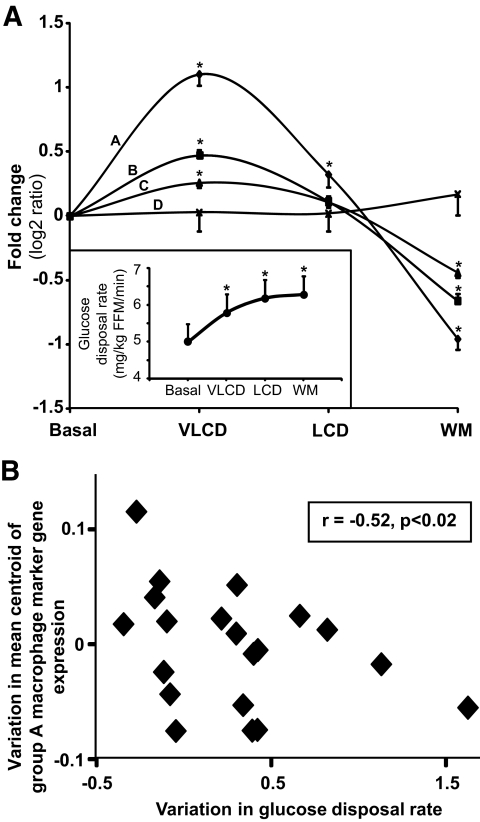
Research design and methods: Twenty-two obese women followed a dietary intervention program composed of an energy restriction phase with a 4-week very-low-calorie diet and a weight stabilization period composed of a 2-month low-calorie diet followed by 3-4 months of a weight maintenance diet. At each time point, a euglycemic-hyperinsulinemic clamp and subcutaneous adipose tissue biopsies were performed. Adipose tissue gene expression profiling was performed using a DNA microarray in a subgroup of eight women. RT-quantitative PCR was used for determination of mRNA levels of 31 adipose tissue macrophage markers (n = 22).

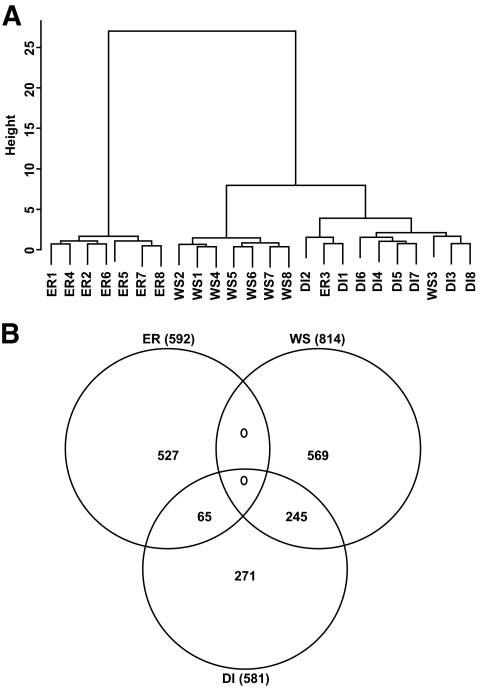
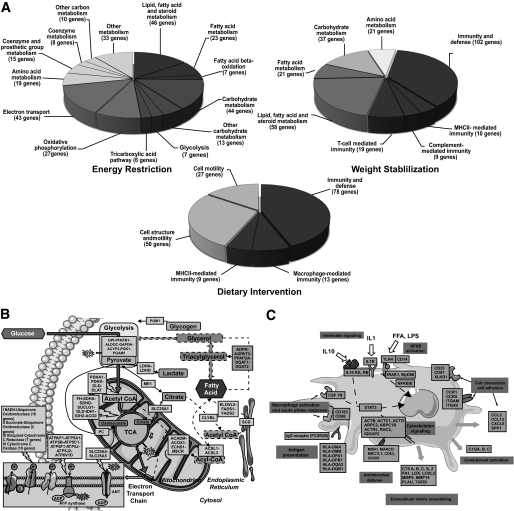
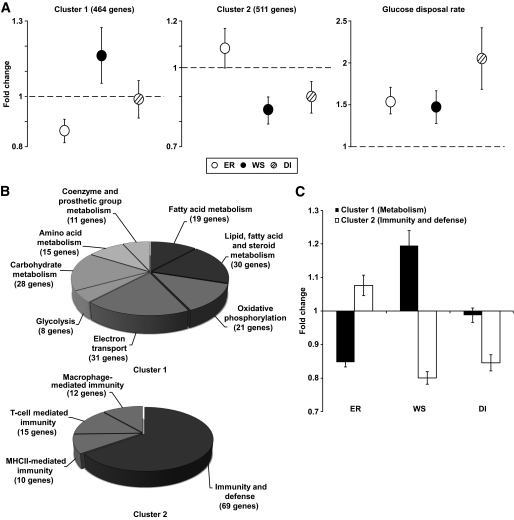
Results: Body weight, fat mass, and C-reactive protein level decreased and glucose disposal rate increased during the dietary intervention program. Transcriptome profiling revealed two main patterns of variations. The first involved 464 mostly adipocyte genes involved in metabolism that were downregulated during energy restriction, upregulated during weight stabilization, and unchanged during the dietary intervention. The second comprised 511 mainly macrophage genes involved in inflammatory pathways that were not changed or upregulated during energy restriction and downregulated during weight stabilization and dietary intervention. Accordingly, macrophage markers were upregulated during energy restriction and downregulated during weight stabilization and dietary intervention. The increase in glucose disposal rates in each dietary phase was associated with variation in expression of sets of 80-110 genes that differed among energy restriction, weight stabilization, and dietary intervention.

Conclusions: Adipose tissue macrophages and adipocytes show distinct patterns of gene regulation and association with insulin sensitivity during the various phases of a dietary weight loss program.


Figures

FIG. 1.
FIG. 1.
Study design of the dietary weight loss program (A) and adipose gene expression analyses (B). A: Upper line segments illustrate subsequent dietary periods and their time duration and cross-points indicate clinical investigation days (see research design and methods). The lower lines show three dietary phases investigated using DNA microarray analysis. B: Flowchart of adipose tissue (AT) gene expression analysis. Twenty-two obese women followed the dietary weight loss program. DNA microarray analysis was performed on adipose tissue from eight of them. Independently, gene expression profiling was performed on the cell types composing subcutaneous adipose tissue from six women to identify adipocyte and macrophage markers. RT-qPCR was used to study the regulation of 31 macrophage markers during the dietary weight loss program.
FIG. 2.
FIG. 2.
DNA microarray analysis of regulated genes in eight subjects during the different phases of a dietary weight loss program. A: Ward's hierarchical clustering of differentially expressed genes. B: Venn diagram of differentially expressed genes. DI, dietary intervention; ER, energy restriction; WS, weight stabilization.
FIG. 3.
FIG. 3.
Gene ontology analysis during the various phases of the dietary weight loss program. A: Significantly enriched pathways using the PANTHER classification system. B: Fatty acid, glucose, and energy metabolism pathways downregulated during energy restriction. The names of genes and cellular specificity are provided in supplementary Table 6. C: Inflammatory and cellular remodeling pathways downregulated during dietary intervention. The names of genes and cellular specificity are provided in supplementary Table 7.
FIG. 4.
FIG. 4.
Analysis of the two main clusters of genes regulated during the dietary intervention program. A: Gene expression profiles in clusters significant at P < 0.05 identified by hierarchical clustering using bootstrap sampling. The number of transcripts in each cluster is shown in parentheses. For comparison, evolution of GDR is also shown. Mean ± SE fold changes in gene expression are shown on the y-axis. Open circles, energy restriction (ER); black circles, weight stabilization (WS); striped circles; dietary intervention (DI). B: Gene ontology analysis. Enriched pathways identified by bootstrap sampling using the PANTHER classification system. C: Mean ± SE fold changes of genes involved in metabolism from cluster 1 (■) and genes involved in immunity and defense from cluster 2 (□) during energy restriction (ER), weight stabilization (WS), and dietary intervention (DI).
FIG. 5.
FIG. 5.
Gene expression of macrophage markers in 22 subjects determined by RT-qPCR at each time point of the dietary weight loss program. A: Mean ± SE fold changes of 31 genes represented as log2 ratio are shown on the y-axis. ANOVA revealed four groups of genes, labeled A–D according to profiles of changes. Inset, evolution of GDR during the different periods of the program. *P < 0.05, compared with basal. B: Relation between changes in GDR and mean centroid of the seven macrophage marker (group A) gene expression during the energy restriction phase. Spearman correlation coefficient and P value are indicated. LCD, low-calorie diet; WM, weigh maintenance.

Similar articles

Cited by

References

    1. Guilherme A, Virbasius JV, Puri V, Czech MP: Adipocyte dysfunctions linking obesity to insulin resistance and type 2 diabetes. Nat Rev Mol Cell Biol 2008; 9: 367– 377 - PMC - PubMed
    1. Hotamisligil GS: Inflammation and metabolic disorders. Nature 2006; 444: 860– 867 - PubMed
    1. Shulman GI: Cellular mechanisms of insulin resistance. J Clin Invest 2000; 106: 171– 176 - PMC - PubMed
    1. Schenk S, Saberi M, Olefsky JM: Insulin sensitivity: modulation by nutrients and inflammation. J Clin Invest 2008; 118: 2992– 3002 - PMC - PubMed
    1. Wolowczuk I, Verwaerde C, Viltart O, Delanoye A, Delacre M, Pot B, Grangette C: Feeding our immune system: impact on metabolism. Clin Dev Immunol 2008: 639803, 2008 - PMC - PubMed

Publication types