. 2009 Jul;37(12):3912-23.
doi: 10.1093/nar/gkp237. Epub 2009 Apr 28.

Cellular responses to DNA double-strand breaks after low-dose gamma-irradiation

Affiliations

Cellular responses to DNA double-strand breaks after low-dose gamma-irradiation

Aroumougame Asaithamby et al. Nucleic Acids Res. 2009 Jul.

Abstract

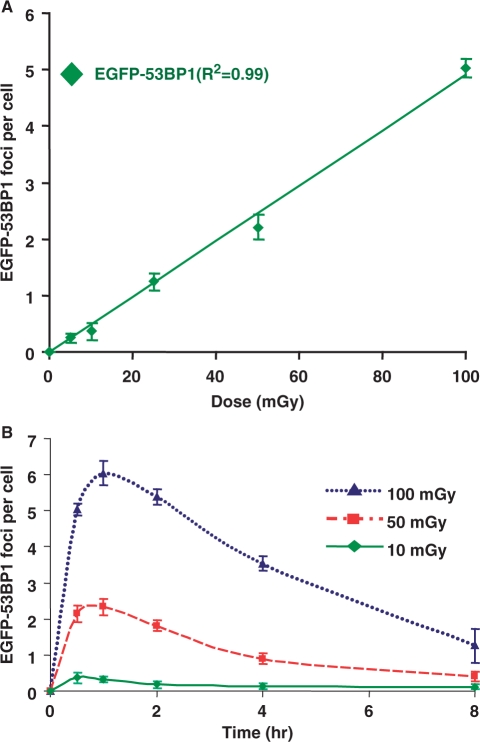
DNA double-strand breaks (DSBs) are a serious threat to genome stability and cell viability. Although biological effects of low levels of radiation are not clear, the risks of low-dose radiation are of societal importance. Here, we directly monitored induction and repair of single DSBs and quantitatively analyzed the dynamics of interaction of DNA repair proteins at individual DSB sites in living cells using 53BP1 fused to yellow fluorescent protein (YFP-53BP1) as a surrogate marker. The number of DSBs formed was linear with dose from 5 mGy to 1 Gy. The DSBs induced by very low radiation doses (5 mGy) were repaired with efficiency similar to repair of DSBs induced at higher doses. The YFP-53BP1 foci are dynamic structures: 53BP1 rapidly and reversibly interacted at these DSB sites. The time frame of recruitment and affinity of 53BP1 for DSB sites were indistinguishable between low and high doses, providing mechanistic evidence for the similar DSB repair after low- and high-dose radiation. These findings have important implications for estimating the risk associated with low-dose radiation exposure on human health.


Figures

Figure 1.
Figure 1.
Characterization of YFP-53BP1-expressing cells. (A) Expression of YFP-53BP1 in HT1080 cells. Nuclear extract from HT1080 and HT1080 YFP-53BP1 cells was analyzed by western blot using an anti-53BP1 polyclonal antibody to detect both endogenous and YFP-53BP1. 53BP1 and YFP-53BP1 were distinguished by the higher molecular weight of YFP-53BP1 fusion protein. (B) YFP-53BP1 foci co-localize with γH2AX in un-irradiated cells. Exponentially growing HT1080-YFP 53BP1 cells were imaged and then fixed. Subsequently, cells were immunostained with γH2AX monoclonal antibody. (C) YFP-53BP1 forms foci in S-phase cells. Exponentially growing HT1080-YFP 53BP1 cells were imaged and then fixed. Cells were immunostained with proliferating cell nuclear antigen (PCNA) monoclonal antibody. (D) Distribution of YFP-53BP1 and γH2AX foci in un-irradiated cells. Images of live cells were acquired prior to immunostaining with γH2AX antibody. The number of foci per cell (left panel) and the distribution (right panel) of YFP-53BP1 and γH2AX were quantitated. More than 200 nuclei were counted and the error bars represent standard deviations calculated from three independent experiments.
Figure 2.
Figure 2.
Recruitment of YFP-53BP1 to DNA DSB sites is dose dependent. (A) Representative images showing co-localization of YFP-53BP1 with γH2AX after exposure of cells to graded doses of γ-rays. Distribution of YFP-53BP1 in HT1080 cells was determined prior to irradiation. Cells were irradiated with indicated doses of γ-rays and pictures were taken after 30 min. Subsequently, cells were fixed and immunostained with anti-γH2AX antibody and images were recorded. (B and C) Induction of YFP-53BP1 foci is dose-dependent in living cells. Graph showing number of YFP-53BP1 and γH2AX foci formed 30 min after exposure of cells to (B) 100–1000 mGy and (C) 5–50 mGy of γ-rays. Cells were imaged prior to γ-irradiation and pictures were captured 30 min after irradiation. The foci in 200–400 cells were counted and this data is presented in the graphs. The error bars represent standard deviations calculated from three independent experiments.
Figure 3.
Figure 3.
DNA DSBs induced by low-dose (5–100 mGy) and high-dose (500 and 1000 mGy) γ-radiation are efficiently repaired. (A) Representative live cell images showing formation and disappearance of YFP-53BP1 foci after indicated doses of γ-radiation. HT1080 cells stably expressing YFP-53BP1 were irradiated with 0, 5, 10, 50, 100, 500 and 1000 mGy of γ-rays; images were collected before and at different time after irradiation using confocal microscopy (LSM 510). (B and C) Number of foci per cell as a function of time following γ-irradiation. Cells were imaged prior to and different times following irradiation. The number of foci per cell was plotted after subtracting the number of foci in the mock-irradiated cells. More than 100–200 cells were counted for each time. The error bars represent standard deviations calculated from three independent experiments.
Figure 4.
Figure 4.
DNA DSBs induced by low-dose (10–100 mGy) γ-radiation are efficiently repaired in human bronchial epithelial cells. (A) Induction of EGFP-53BP1 foci is dose-dependent in living HBECs. Graph showing number of EGFP-53BP1 foci formed 30 min after exposure of hTERT immortalized HBECs to 5, 10, 25, 50 and 100 mGy of γ-radiation. hTERT immortalized HBECs stably expressing EGFP-53BP1 were imaged prior to γ-irradiation and images were captured 30 min after irradiation. The foci in 100–200 cells were counted and this data is presented in the graphs. The error bars represent standard deviations calculated from three independent experiments. (B) Number of foci per cell as a function of time following γ-irradiation. HBECs stably expressing EGFP-53BP1 were imaged prior to and different times following irradiation. The number of foci per cell was plotted after subtracting the number of foci in the mock-irradiated cells. More than 100–200 cells were counted for each time. The error bars represent standard deviations calculated from three independent experiments.
Figure 5.
Figure 5.
Kinetics of YFP-53BP1 accumulation at DSB sites is dose independent. (A) Representative live cell images showing assembly kinetics of YFP-53BP1 foci after 100, 500 and 1000-mGy γ-irradiation. HT1080 cells stably expressing YFP-53BP1 were irradiated and images were collected before and at indicated times after γ-irradiation using confocal microscopy (LSM 510). (B) YFP-53BP1 assembly kinetics at the DNA damage sites is not influenced by the number of DSBs. For every cell, images were captured prior to irradiation and after irradiation. Time-lapse images were captured every 5 min. The fluorescent intensity of the YFP-53BP1 accumulation at the DSB sites was measured before and after irradiation, and the normalized fluorescent intensity was calculated as described in the ‘Materials and Methods’ section. Each data point depicted in the graph is the average of normalized YFP-53BP1 fluorescence measurements from 20 cells. The error bars represent standard deviation.
Figure 6.
Figure 6.
DNA-YFP-53BP1 complex is reversible. (A) Examples of fluorescence recovery of YFP-53BP1 in nonirradiated and irradiated cells. Images of HT1080 cells stably expressing YFP-53BP1 were taken before γ-irradiation (Pre-IR), 30 min after γ-irradiation, and/or before photo bleaching (Pre-bleach), immediately after the photo bleaching (bleach), and at indicated times after bleaching. The photobleached regions are indicated in white dotted circles. (B) Fluorescence recovery kinetics curves for nonirradiated and irradiated cells. For every cell, images were taken before γ-irradiation (Pre-IR), 30 min after γ-irradiation, and/or before photo bleaching (Pre-bleach), immediately after the photo bleaching (bleach), and at different times after bleaching. In every image, average fluorescent intensity of the photobleached YFP-53BP1 focus was measured as a function of time, and then divided it by the average fluorescent intensity measured elsewhere in the cell as a function of time. To get normalized FRAP curve for each cell, the YFP-53BP1 fluorescent intensity after the photobleaching was divided by the prebleach intensity and the prebleach intensity was set to one. Each data point depicted in the graph is the average of 20 independent, normalized measurements. The error bars represent the STDEV.

References

    1. Elliott B, Jasin M. Double-strand breaks and translocations in cancer. Cell Mol. Life Sci. 2002;59:373–385. - PMC - PubMed
    1. Bonner WM. Low-dose radiation: thresholds, bystander effects, and adaptive responses. Proc. Natl Acad. Sci. USA. 2003;100:4973–4975. - PMC - PubMed
    1. Prasad KN, Cole WC, Hasse GM. Health risks of low dose ionizing radiation in humans: a review. Exp. Biol. Med. 2004;229:378–382. - PubMed
    1. Morgan WF. Non-targeted and delayed effects of exposure to ionizing radiation: I. Radiation-induced genomic instability and bystander effects in vitro. Radiat. Res. 2003;159:567–580. - PubMed
    1. Strzelczyk JJ, Damilakis J, Marx MV, Macura KJ. Facts and controversies about radiation exposure, part 2: low-level exposures and cancer risk. J. Am. Coll. Radiol. 2007;4:32–39. - PubMed

Publication types

Substances