. 2009 Apr 28;2(68):ra19.
doi: 10.1126/scisignal.2000102.

Neurotransmitters drive combinatorial multistate postsynaptic density networks

Affiliations

Neurotransmitters drive combinatorial multistate postsynaptic density networks

Marcelo P Coba et al. Sci Signal. .

Abstract

The mammalian postsynaptic density (PSD) comprises a complex collection of approximately 1100 proteins. Despite extensive knowledge of individual proteins, the overall organization of the PSD is poorly understood. Here, we define maps of molecular circuitry within the PSD based on phosphorylation of postsynaptic proteins. Activation of a single neurotransmitter receptor, the N-methyl-D-aspartate receptor (NMDAR), changed the phosphorylation status of 127 proteins. Stimulation of ionotropic and metabotropic glutamate receptors and dopamine receptors activated overlapping networks with distinct combinatorial phosphorylation signatures. Using peptide array technology, we identified specific phosphorylation motifs and switching mechanisms responsible for the integration of neurotransmitter receptor pathways and their coordination of multiple substrates in these networks. These combinatorial networks confer high information-processing capacity and functional diversity on synapses, and their elucidation may provide new insights into disease mechanisms and new opportunities for drug discovery.


Figures

Fig. 1
Fig. 1
NMDA stimulation of hippocampal slices. (A) NMDA-mediated changes in the phosphorylation status of 127 proteins of the PSD (detected by MS). (B) NMDA-dependent modulation of 9 of 23 different kinases from five groups, detected by immunoblot 3 min after NMDAR stimulation. (C) Modulation of 7 kinases was assayed by immunoblotting with phosphospecific antibodies of hippocampal slice extracts after NMDA stimulation. Peak changes occurred between 3 and 5 min after stimulation, and phosphorylation returned to the basal state after 40 min.
Fig. 2
Fig. 2
Overlapping networks driven by NMDA, mGlu and dopamine receptors, and PKA and PKC. Phosphorylation on NMDA (NR1, NR2B) and AMPA subunits (GluR1, GluR2) (10 total) was monitored with phosphospecific antibodies after stimulation. The following receptors were stimulated with the indicated agonists: NMDAR: NMDA (20 μM), dopamine D1–like agonist (6-Cl-PB, 50 μM), mGluR (DHPG, 50 μM). PKA was activated directly with forskolin (50 μM) and PKC with PdBu (10 μM). Red: increase in phosphorylation compared to control; yellow: no change; blue: decrease.
Fig. 3
Fig. 3
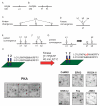
Regulatory motifs and mapping of kinase sites. (A and B) Sequences contain single (A) or multiple (B) sites and regulatory motifs representing different phosphorylation events were described by their substrate-kinase interactions (C to G). s, substrate. (C) Kinase divergence: a single kinase can phosphorylate multiple independent sequences. k, kinase, P, phosphate. (D) Kinase convergence: single site sequence phosphorylated by multiple kinases. (E) Paired convergence: multiple site sequence with two different kinases phosphorylating each site. (F) Paired convergence: multiple site sequence with a single kinase phosphorylating each site. (G) Primed convergence: phosphorylation sites within 10 amino acids of each other presenting priming effects in which the presence of phosphate on site 1 influences phosphorylation of site 2. (H) Scheme for kinase site identification on peptide substrates. Fifteen amino acid peptides containing a phosphorylation site and a control peptide (for instance, in which a serine site was substituted with an alanine) were immobilized and phosphorylated on glass slides. Representative phosphoimages of 32P-labeled arrays after kinase reactions with PKA (triplicate samples) and six other kinases. JNK3, c-Jun N-terminal kinase 3 Fes, c-fps/fes proto-oncogene tyrosine kinase. ROCK-II, Rho-associated kinase 2.
Fig. 4
Fig. 4
Postsynaptic phosphoproteome network. The network was constructed by linking kinases to their respective substrates, which include other kinases. We separated the network into groups of proteins (with a high density of links within each group and a lower density of links between different groups) with the use of an unsupervised clustering algorithm. In the diagram, each group was separated into two levels (one level containing kinases, the other containing substrates) for ease of viewing. Kinases were not randomly distributed within this clustering: One cluster was enriched with basophilic kinases (although it also contained other kinases), another was enriched with proline-directed kinases, and so forth. Thus, the network of phosphorylation interactions shows evidence of a broad organizational pattern based on kinase classes, although there is cross talk. For each substrate, phosphorylation sites were categorized into regulatory motifs (Fig. 3). Adjacent to each substrate is a “barcode” composed of five boxes (shaded either black or white) indicating the presence (black) or absence (white) of particular regulatory motifs within that substrate. Kinases (top) and substrate (bottom) interactions were graphed (gray lines) and clustered with the algorithm of Newman and Girvan (69). Functional classes of substrates are shown (colored symbols, see key).
Fig. 5
Fig. 5
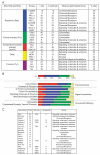
Distribution of kinase types, sequence motifs, classes of proteins and hubs in phosphorylated substrates. (A) Protein kinases were grouped by their preferred sequence specificity into five categories: basophilic (blue), proline-directed (green), acid and phosphate-directed (red), other (yellow), and tyrosine (purple). The number of sites phosphorylated by each kinase is shown, with the top substrate class targeted by each kinase and the percentage of the total number of phosphorylated sites detected. Columns indicate specific kinases (kinase), the total number of substrate phosphorylation sites (n site), and total number of protein substrates (n substrate) and preferred functional class of substrates (most phosphorylated family) with the percentage of that substrate shown (% sites). (B) Proportion of (peptide array) Ser/Thr phosphorylation events due to each kinase group (color coding as in A). Shows percentage of all Ser/Thr phosphorylation events and of events for each functional class of substrate. Note uneven distribution, with proline-directed kinases showing a preference for structural and trafficking substrates. (C) Hubs or highly phosphorylated substrates phosphorylated by 10 or more kinases. Total, number of kinases that phosphorylate that protein. N kinase/site, number of kinases that phosphorylate the Hub site.
Fig. 6
Fig. 6
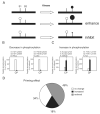
Phosphorylation site interactions on priming arrays. (A) Interaction between phosphorylation sites in multiple phosphorylated sequences. Peptides with two phosphorylation sites (S1, site 1; S2, site 2) are represented (top left) and, after kinase reaction that is specific to site 2, we measured the incorporation of 32P (black circle, top right). Peptides synthesized with a phosphate on site 1 (white circle, lower left) are used in the same kinase reaction and the site 2 incorporation measured (black circle, lower right). An increase or decrease in site 2 phosphorylation is indicated by the larger or smaller black symbol. (B) Two examples (NR1, PSD95) in which introduction of a phosphorylation site into a sequence (S1) decreased the total phosphorylation of a second phosphorylation site (S2). Each histogram shows the site 2 phosphorylation (% control) for peptide control (C, corresponds to top right peptide in A) and its primed variant (P, corresponds to bottom right peptide in A) for the representative kinase (k). (C) In contrast to (B), two examples (Kcnab2, PDK-1) in which the introduction of a phosphorylation site into a peptide sequence (S1) increased the total phosphorylation of a second phosphorylation site (S2). (D) The overall effect of priming on all peptides shows that 34% had no effect, whereas 48% were inhibitory and 18% were enhancing.

References

    1. Kandel ER. The molecular biology of memory storage: A dialogue between genes and synapses. Science. 2001;294:1030–1038. - PubMed
    1. Shepherd JD, Huganir RL. The cell biology of synaptic plasticity: AMPA receptor trafficking. Annu. Rev. Cell Dev. Biol. 2007;23:613–643. - PubMed
    1. Sheng M, Kim MJ. Postsynaptic signaling and plasticity mechanisms. Science. 2002;298:776–780. - PubMed
    1. Collins MO, Husi H, Yu L, Brandon JM, Anderson CN, Blackstock WP, Choudhary JS, Grant SG. Molecular characterization and comparison of the components and multiprotein complexes in the postsynaptic proteome. J. Neurochem. 2006;97:16–23. - PubMed
    1. Husi H, Ward MA, Choudhary JS, Blackstock WP, Grant SG. Proteomic analysis of NMDA receptor-adhesion protein signaling complexes. Nat. Neurosci. 2000;3:661–669. - PubMed

MeSH terms

LinkOut - more resources