

Discovering structural cis-regulatory elements by modeling the behaviors of mRNAs
- PMID: 19401680
- PMCID: PMC2683727
- DOI: 10.1038/msb.2009.24
Discovering structural cis-regulatory elements by modeling the behaviors of mRNAs
Abstract
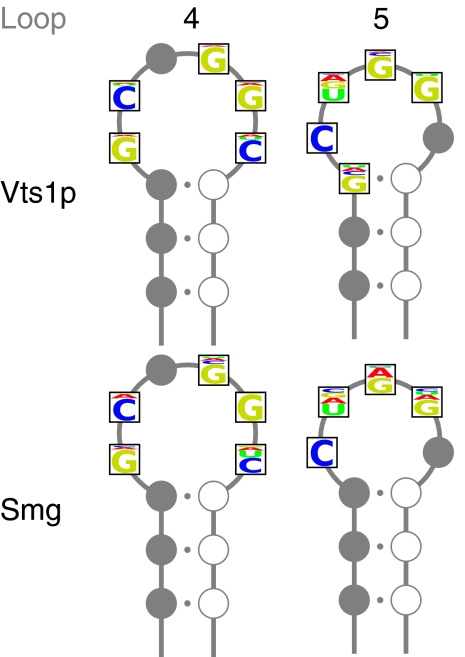
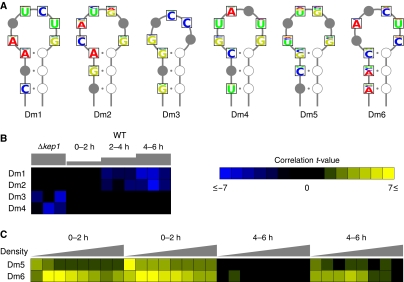
Gene expression is regulated at each step from chromatin remodeling through translation and degradation. Several known RNA-binding regulatory proteins interact with specific RNA secondary structures in addition to specific nucleotides. To provide a more comprehensive understanding of the regulation of gene expression, we developed an integrative computational approach that leverages functional genomics data and nucleotide sequences to discover RNA secondary structure-defined cis-regulatory elements (SCREs). We applied our structural cis-regulatory element detector (StructRED) to microarray and mRNA sequence data from Saccharomyces cerevisiae, Drosophila melanogaster, and Homo sapiens. We recovered the known specificities of Vts1p in yeast and Smaug in flies. In addition, we discovered six putative SCREs in flies and three in humans. We characterized the SCREs based on their condition-specific regulatory influences, the annotation of the transcripts that contain them, and their locations within transcripts. Overall, we show that modeling functional genomics data in terms of combined RNA structure and sequence motifs is an effective method for discovering the specificities and regulatory roles of RNA-binding proteins.
Conflict of interest statement
The authors declare that they have no conflict of interest.
Figures


Similar articles
-
Poly(A)-tail-promoted translation in yeast: implications for translational control.RNA. 1998 Nov;4(11):1321-31. doi: 10.1017/s1355838298980669. RNA. 1998. PMID: 9814754 Free PMC article.
-
Genome-wide analysis of mRNA lengths in Saccharomyces cerevisiae.Genome Biol. 2003;5(1):R2. doi: 10.1186/gb-2003-5-1-r2. Epub 2003 Dec 22. Genome Biol. 2003. PMID: 14709174 Free PMC article.
-
Drosophila maternal Hsp83 mRNA destabilization is directed by multiple SMAUG recognition elements in the open reading frame.Mol Cell Biol. 2008 Nov;28(22):6757-72. doi: 10.1128/MCB.00037-08. Epub 2008 Sep 15. Mol Cell Biol. 2008. PMID: 18794360 Free PMC article.
-
A systematic analysis of disease-associated variants in the 3' regulatory regions of human protein-coding genes II: the importance of mRNA secondary structure in assessing the functionality of 3' UTR variants.Hum Genet. 2006 Oct;120(3):301-33. doi: 10.1007/s00439-006-0218-x. Epub 2006 Jun 29. Hum Genet. 2006. PMID: 16807757 Review.
-
Protein Binding to Cis-Motifs in mRNAs Coding Sequence Is Common and Regulates Transcript Stability and the Rate of Translation.Cells. 2021 Oct 27;10(11):2910. doi: 10.3390/cells10112910. Cells. 2021. PMID: 34831133 Free PMC article. Review.
Cited by
-
Revealing protein-lncRNA interaction.Brief Bioinform. 2016 Jan;17(1):106-16. doi: 10.1093/bib/bbv031. Epub 2015 Jun 2. Brief Bioinform. 2016. PMID: 26041786 Free PMC article. Review.
-
TARBP2 binding structured RNA elements drives metastasis.Cell Cycle. 2014;13(18):2799-800. doi: 10.4161/15384101.2014.954453. Cell Cycle. 2014. PMID: 25486461 Free PMC article. No abstract available.
-
Modeling the specificity of protein-DNA interactions.Quant Biol. 2013 Jun;1(2):115-130. doi: 10.1007/s40484-013-0012-4. Quant Biol. 2013. PMID: 25045190 Free PMC article.
-
Identification of RNA recognition elements in the Saccharomyces cerevisiae transcriptome.Nucleic Acids Res. 2011 Mar;39(4):1501-9. doi: 10.1093/nar/gkq920. Epub 2010 Oct 18. Nucleic Acids Res. 2011. PMID: 20959291 Free PMC article.
-
High-throughput characterization of protein-RNA interactions.Brief Funct Genomics. 2015 Jan;14(1):74-89. doi: 10.1093/bfgp/elu047. Epub 2014 Dec 13. Brief Funct Genomics. 2015. PMID: 25504152 Free PMC article. Review.
References
-
- Altschul SF, Gish W, Miller W, Myers EW, Lipman DJ (1990) Basic local alignment search tool. J Mol Biol 215: 403–410 - PubMed
-
- Ashburner M, Ball CA, Blake JA, Botstein D, Butler H, Cherry JM, Davis AP, Dolinski K, Dwight SS, Eppig JT, Harris MA, Hill DP, Issel-Tarver L, Kasarskis A, Lewis S, Matese JC, Richardson JE, Ringwald M, Rubin GM, Sherlock G (2000) Gene ontology: tool for the unification of biology. The Gene Ontology Consortium. Nat Genet 25: 25–29 - PMC - PubMed
-
- Aviv T, Amborski AN, Zhao XS, Kwan JJ, Johnson PE, Sicheri F, Donaldson LW (2006a) The NMR and X-ray structures of the Saccharomyces cerevisiae Vts1 SAM domain define a surface for the recognition of RNA hairpins. J Mol Biol 356: 274–279 - PubMed
-
- Aviv T, Lin Z, Ben-Ari G, Smibert CA, Sicheri F (2006b) Sequence-specific recognition of RNA hairpins by the SAM domain of Vts1p. Nat Struct Mol Biol 13: 168–176 - PubMed
-
- Aviv T, Lin Z, Lau S, Rendl LM, Sicheri F, Smibert CA (2003) The RNA-binding SAM domain of Smaug defines a new family of post-transcriptional regulators. Nat Struct Biol 10: 614–621 - PubMed
Publication types
MeSH terms
Substances
Grants and funding
LinkOut - more resources
Full Text Sources
Molecular Biology Databases
