

Genetic determinants of facial clefting: analysis of 357 candidate genes using two national cleft studies from Scandinavia
- PMID: 19401770
- PMCID: PMC2671138
- DOI: 10.1371/journal.pone.0005385
Genetic determinants of facial clefting: analysis of 357 candidate genes using two national cleft studies from Scandinavia
Abstract
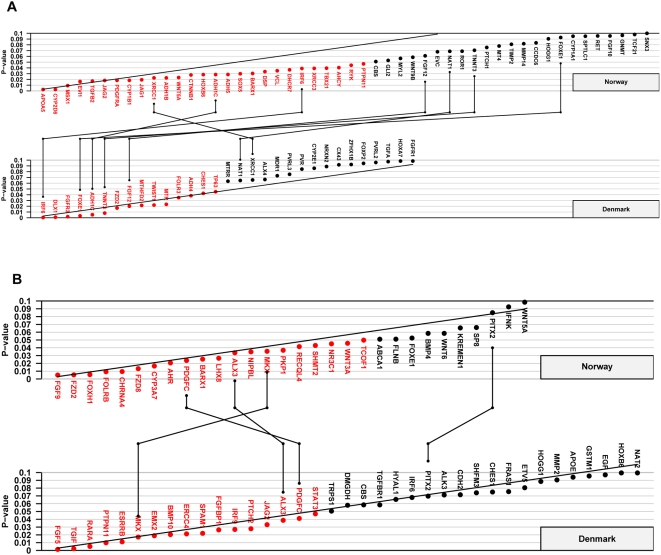
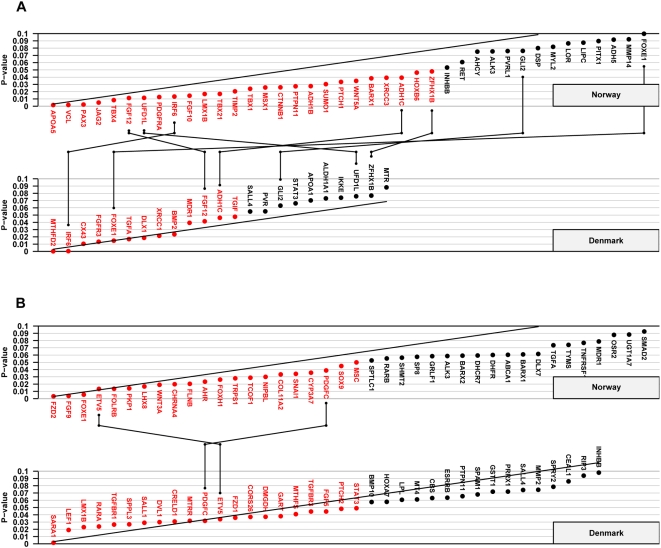
Background: Facial clefts are common birth defects with a strong genetic component. To identify fetal genetic risk factors for clefting, 1536 SNPs in 357 candidate genes were genotyped in two population-based samples from Scandinavia (Norway: 562 case-parent and 592 control-parent triads; Denmark: 235 case-parent triads).
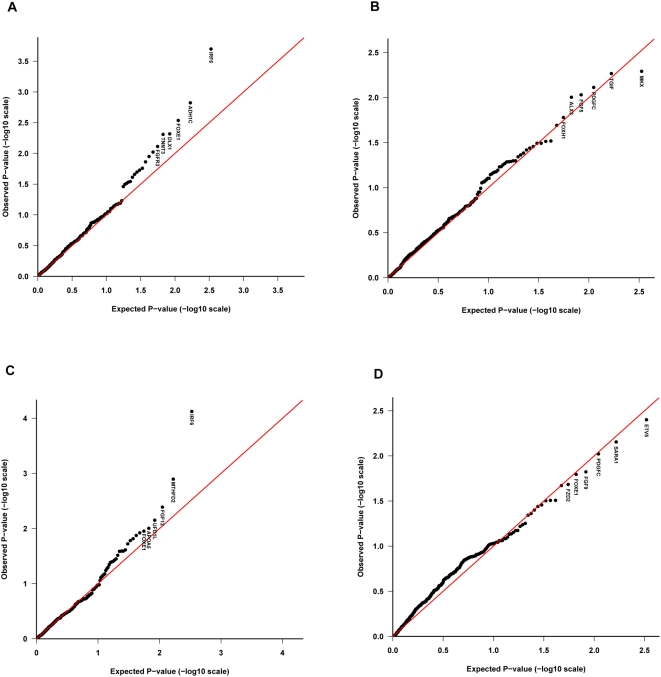
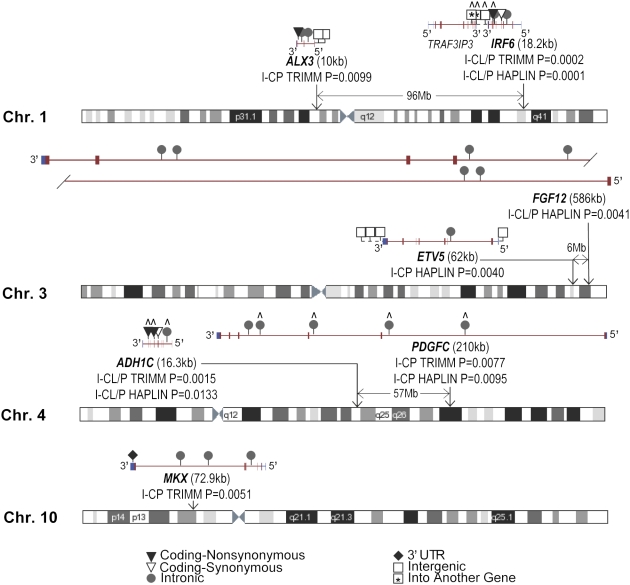
Methodology/principal findings: We used two complementary statistical methods, TRIMM and HAPLIN, to look for associations across these two national samples. TRIMM tests for association in each gene by using multi-SNP genotypes from case-parent triads directly without the need to infer haplotypes. HAPLIN on the other hand estimates the full haplotype distribution over a set of SNPs and estimates relative risks associated with each haplotype. For isolated cleft lip with or without cleft palate (I-CL/P), TRIMM and HAPLIN both identified significant associations with IRF6 and ADH1C in both populations, but only HAPLIN found an association with FGF12. For isolated cleft palate (I-CP), TRIMM found associations with ALX3, MKX, and PDGFC in both populations, but only the association with PDGFC was identified by HAPLIN. In addition, HAPLIN identified an association with ETV5 that was not detected by TRIMM.
Conclusion/significance: Strong associations with seven genes were replicated in the Scandinavian samples and our approach effectively replicated the strongest previously known association in clefting--with IRF6. Based on two national cleft cohorts of similar ancestry, two robust statistical methods and a large panel of SNPs in the most promising cleft candidate genes to date, this study identified a previously unknown association with clefting for ADH1C and provides additional candidates and analytic approaches to advance the field.
Conflict of interest statement
Figures
Similar articles
-
Maternal genes and facial clefts in offspring: a comprehensive search for genetic associations in two population-based cleft studies from Scandinavia.PLoS One. 2010 Jul 9;5(7):e11493. doi: 10.1371/journal.pone.0011493. PLoS One. 2010. PMID: 20634891 Free PMC article.
-
X-linked genes and risk of orofacial clefts: evidence from two population-based studies in Scandinavia.PLoS One. 2012;7(6):e39240. doi: 10.1371/journal.pone.0039240. Epub 2012 Jun 19. PLoS One. 2012. PMID: 22723972 Free PMC article.
-
Genetic variants in IRF6 and the risk of facial clefts: single-marker and haplotype-based analyses in a population-based case-control study of facial clefts in Norway.Genet Epidemiol. 2008 Jul;32(5):413-24. doi: 10.1002/gepi.20314. Genet Epidemiol. 2008. PMID: 18278815 Free PMC article.
-
Toward an orofacial gene regulatory network.Dev Dyn. 2016 Mar;245(3):220-32. doi: 10.1002/dvdy.24341. Epub 2015 Sep 17. Dev Dyn. 2016. PMID: 26332872 Free PMC article. Review.
-
Cleft-twin sets in Finland 1948-1987.Cleft Palate Craniofac J. 1996 Jul;33(4):340-7. doi: 10.1597/1545-1569_1996_033_0340_ctsif_2.3.co_2. Cleft Palate Craniofac J. 1996. PMID: 8827393 Review.
Cited by
-
Genetics of nonsyndromic orofacial clefts.Cleft Palate Craniofac J. 2012 Jan;49(1):73-91. doi: 10.1597/10-178. Epub 2011 May 5. Cleft Palate Craniofac J. 2012. PMID: 21545302 Free PMC article. Review.
-
Interaction between IRF6 and TGFA genes contribute to the risk of nonsyndromic cleft lip/palate.PLoS One. 2012;7(9):e45441. doi: 10.1371/journal.pone.0045441. Epub 2012 Sep 20. PLoS One. 2012. PMID: 23029012 Free PMC article.
-
Genetics and signaling mechanisms of orofacial clefts.Birth Defects Res. 2020 Nov;112(19):1588-1634. doi: 10.1002/bdr2.1754. Epub 2020 Jul 15. Birth Defects Res. 2020. PMID: 32666711 Free PMC article. Review.
-
Two novel genes TOX3 and COL21A1 in large extended Malay families with nonsyndromic cleft lip and/or palate.Mol Genet Genomic Med. 2019 May;7(5):e635. doi: 10.1002/mgg3.635. Epub 2019 Mar 28. Mol Genet Genomic Med. 2019. PMID: 30924295 Free PMC article.
-
Palatogenesis and cutaneous repair: A two-headed coin.Dev Dyn. 2015 Mar;244(3):289-310. doi: 10.1002/dvdy.24224. Epub 2014 Nov 25. Dev Dyn. 2015. PMID: 25370680 Free PMC article. Review.
References
-
- Mossey PA, Little J. Epidemiology of oral clefts: an international perspective. In: Wyszynski DFE, editor. Cleft lip and palate: from origin to treatment. New York: Oxford University Press; 2002.
-
- Lie RT, Wilcox AJ, Skjaerven R. A population-based study of the risk of recurrence of birth defects. N Engl J Med. 1994;331:1–4. - PubMed
Publication types
MeSH terms
Substances
Grants and funding
- R37 DE008559/DE/NIDCR NIH HHS/United States
- R01 DE014667/DE/NIDCR NIH HHS/United States
- N01 HG065403/HG/NHGRI NIH HHS/United States
- P30 ES005605/ES/NIEHS NIH HHS/United States
- R01 DE011948/DE/NIDCR NIH HHS/United States
- ImNIH/Intramural NIH HHS/United States
- P30 ES05605/ES/NIEHS NIH HHS/United States
- R01 DE008559/DE/NIDCR NIH HHS/United States
- K02 DE015291/DE/NIDCR NIH HHS/United States
- P60 DE013076/DE/NIDCR NIH HHS/United States
- P60 DE13076/DE/NIDCR NIH HHS/United States
- R01 DE-11948-04/DE/NIDCR NIH HHS/United States
- DE08559/DE/NIDCR NIH HHS/United States
LinkOut - more resources
Full Text Sources
Medical
Miscellaneous
