

Modulation of internal model formation during force field-induced motor learning by anodal transcranial direct current stimulation of primary motor cortex
- PMID: 19403605
- PMCID: PMC2718253
- DOI: 10.1113/jphysiol.2009.169284
Modulation of internal model formation during force field-induced motor learning by anodal transcranial direct current stimulation of primary motor cortex
Abstract
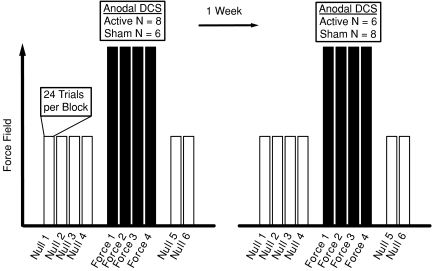
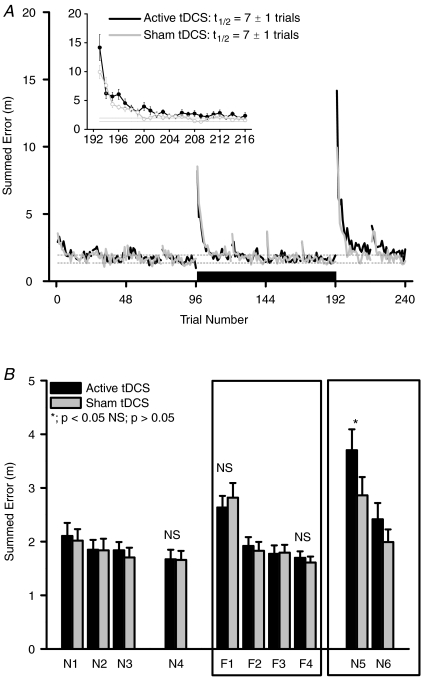
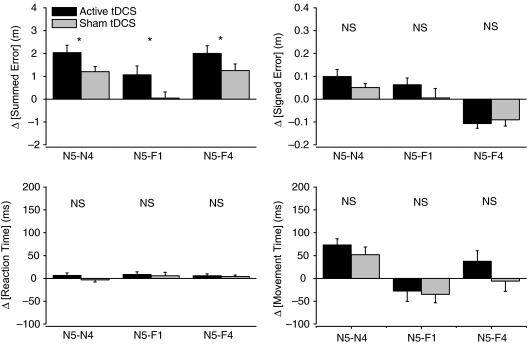
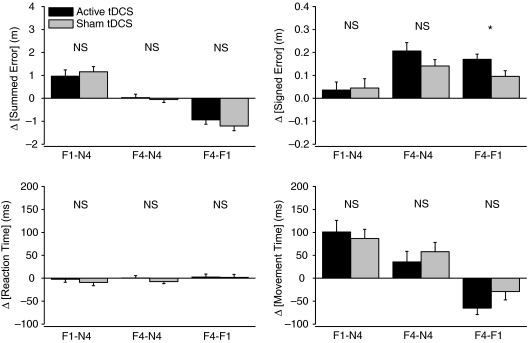
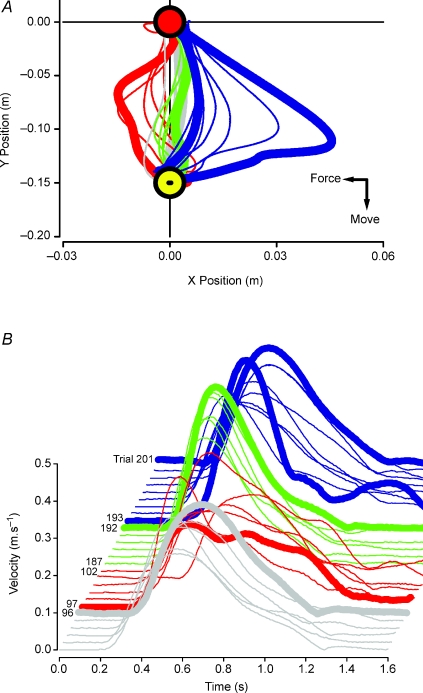
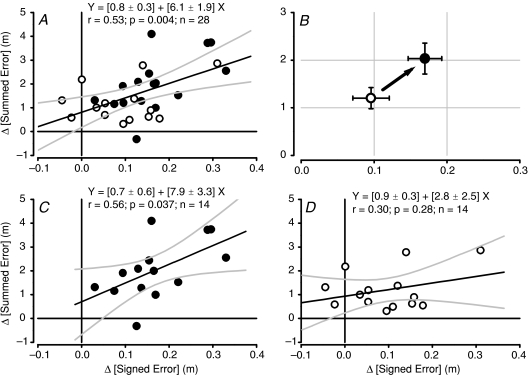
Human subjects can quickly adapt and maintain performance of arm reaching when experiencing novel physical environments such as robot-induced velocity-dependent force fields. Using anodal transcranial direct current stimulation (tDCS) this study showed that the primary motor cortex may play a role in motor adaptation of this sort. Subjects performed arm reaching movement trials in three phases: in a null force field (baseline), in a velocity-dependent force field (adaptation; 25 N s m(-1)) and once again in a null force field (de-adaptation). Active or sham tDCS was directed to the motor cortex representation of biceps brachii muscle during the adaptation phase of the motor learning protocol. During the adaptation phase, the global error in arm reaching (summed error from an ideal trajectory) was similar in both tDCS conditions. However, active tDCS induced a significantly greater global reaching (overshoot) error during the early stage of de-adaptation compared to the sham tDCS condition. The overshoot error may be representative of the development of a greater predictive movement to overcome the expected imposed force. An estimate of the predictive, initial movement trajectory (signed error in the first 150 ms of movement) was significantly augmented during the adaptation phase with active tDCS compared to sham tDCS. Furthermore, this increase was linearly related to the change of the overshoot summed error in the de-adaptation process. Together the results suggest that anodal tDCS augments the development of an internal model of the novel adapted movement and suggests that the primary motor cortex is involved in adaptation of reaching movements of healthy human subjects.
Figures
Similar articles
-
No effects of cerebellar transcranial direct current stimulation on force field and visuomotor reach adaptation in young and healthy subjects.J Neurophysiol. 2019 Jun 1;121(6):2112-2125. doi: 10.1152/jn.00352.2018. Epub 2019 Apr 3. J Neurophysiol. 2019. PMID: 30943093
-
Sensorimotor Robotic Measures of tDCS- and HD-tDCS-Enhanced Motor Learning in Children.Neural Plast. 2018 Dec 18;2018:5317405. doi: 10.1155/2018/5317405. eCollection 2018. Neural Plast. 2018. PMID: 30662456 Free PMC article. Clinical Trial.
-
Cerebellar patients do not benefit from cerebellar or M1 transcranial direct current stimulation during force-field reaching adaptation.J Neurophysiol. 2017 Aug 1;118(2):732-748. doi: 10.1152/jn.00808.2016. Epub 2017 May 3. J Neurophysiol. 2017. PMID: 28469001 Free PMC article.
-
Modulation of motor performance and motor learning by transcranial direct current stimulation.Curr Opin Neurol. 2011 Dec;24(6):590-6. doi: 10.1097/WCO.0b013e32834c3db0. Curr Opin Neurol. 2011. PMID: 21968548 Review.
-
Using non-invasive brain stimulation to modulate performance in visuomotor rotation adaptation: A scoping review.Cortex. 2025 Jun;187:144-158. doi: 10.1016/j.cortex.2025.04.010. Epub 2025 Apr 30. Cortex. 2025. PMID: 40347675
Cited by
-
Effects of anodal transcranial direct current stimulation on visually guided learning of grip force control.Biology (Basel). 2015 Mar 2;4(1):173-86. doi: 10.3390/biology4010173. Biology (Basel). 2015. PMID: 25738809 Free PMC article.
-
Variant Target Effects on Motor Learning With M1 Anodal tDCS.Brain Behav. 2025 Aug;15(8):e70743. doi: 10.1002/brb3.70743. Brain Behav. 2025. PMID: 40760800 Free PMC article. Clinical Trial.
-
Induced sensorimotor cortex plasticity remediates chronic treatment-resistant visual neglect.Elife. 2017 Sep 12;6:e26602. doi: 10.7554/eLife.26602. Elife. 2017. PMID: 28893377 Free PMC article.
-
Disruption of speech motor adaptation with repetitive transcranial magnetic stimulation of the articulatory representation in primary motor cortex.Cortex. 2021 Dec;145:115-130. doi: 10.1016/j.cortex.2021.09.008. Epub 2021 Oct 6. Cortex. 2021. PMID: 34717269 Free PMC article.
-
Tracking the Effect of Cathodal Transcranial Direct Current Stimulation on Cortical Excitability and Connectivity by Means of TMS-EEG.Front Neurosci. 2018 May 15;12:319. doi: 10.3389/fnins.2018.00319. eCollection 2018. Front Neurosci. 2018. PMID: 29867330 Free PMC article.
References
-
- Baraduc P, Lang N, Rothwell JC, Wolpert DM. Consolidation of dynamic motor learning is not disrupted by rTMS of primary motor cortex. Curr Biol. 2004;14:252–256. - PubMed
-
- Darainy M, Ostry DJ. Muscle co-contraction following dynamics learning. Exp Brain Res. 2008;190:153–163. - PubMed
-
- Davidson PR, Wolpert DM. Scaling down motor memories: de-adaptation after motor learning. Neurosci Lett. 2004;370:102–107. - PubMed
-
- Donchin O, Sawaki L, Madupu G, Cohen LG, Shadmehr R. Mechanisms influencing acquisition and recall of motor memories. J Neurophysiol. 2002;88:2114–2123. - PubMed
Publication types
MeSH terms
LinkOut - more resources
Full Text Sources
Miscellaneous