. 2009 Aug;297(2):F517-36.
doi: 10.1152/ajprenal.90496.2008. Epub 2009 Apr 29.

A mathematical model of O2 transport in the rat outer medulla. I. Model formulation and baseline results

Affiliations

A mathematical model of O2 transport in the rat outer medulla. I. Model formulation and baseline results

Jing Chen et al. Am J Physiol Renal Physiol. 2009 Aug.

Abstract

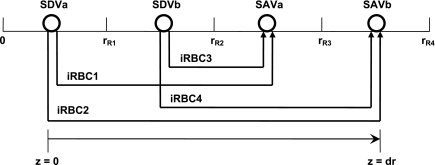
The mammalian kidney is particularly vulnerable to hypoperfusion, because the O(2) supply to the renal medulla barely exceeds its O(2) requirements. In this study, we examined the impact of the complex structural organization of the rat outer medulla (OM) on O(2) distribution. We extended the region-based mathematical model of the rat OM developed by Layton and Layton (Am J Physiol Renal Physiol 289: F1346-F1366, 2005) to incorporate the transport of RBCs, Hb, and O(2). We considered basal cellular O(2) consumption and O(2) consumption for active transport of NaCl across medullary thick ascending limb epithelia. Our model predicts that the structural organization of the OM results in significant Po(2) gradients in the axial and radial directions. The segregation of descending vasa recta, the main supply of O(2), at the center and immediate periphery of the vascular bundles gives rise to large radial differences in Po(2) between regions, limits O(2) reabsorption from long descending vasa recta, and helps preserve O(2) delivery to the inner medulla. Under baseline conditions, significantly more O(2) is transferred radially between regions by capillary flow, i.e., advection, than by diffusion. In agreement with experimental observations, our results suggest that 79% of the O(2) supplied to the medulla is consumed in the OM and that medullary thick ascending limbs operate on the brink of hypoxia.


Figures

Fig. 1.
Fig. 1.
Schematic representation of the region-based model: cross sections through outer stripe (A) and inner stripe (B) of rat outer medulla (OM). In the model formulation, the 4 regions (R1–R4) have coincident centers; display is intended to minimize the figure area. LDV, long descending vas rectum; SDVa and SDVb, 2 populations of short descending vasa recta; LAVa and LAVb, 2 populations of long ascending vasa recta; SAVa and SAVb, 2 populations of short ascending vasa recta; LDL, long descending limb of Henle's loop; SDL, short descending limb; LAL, long ascending limb; SAL, short ascending limb; CD, collecting duct. Relative weight of interaction between a type of vessel or tubule and a given region (i.e., the parameter κi,R in Eqs. A31, A32, A41, and A42) is represented by 0.25, 0.5, and 0.75.
Fig. 2.
Fig. 2.
Schematic representation of interstitial RBC (iRBC) tubes that carry capillary RBC flow from the SDV (SDVa in R1, SDVb in R2) that terminate at a given level x, along the radial (z) direction, to the SAV (SAVa in R3, SAVb in R4) that originate at that level. RBCs travel a radial distance dr before being taken up by SAV. rRi, outer radius of region Ri (i = 1, 2, 3, and 4). We assume that each population of short vasa recta is, on average, localized in the center of the region where it is distributed.
Fig. 3.
Fig. 3.
Po2 in tubules, vasa recta, and concentric regions. A, B, C, and D: regions R1, R2, R3, and R4, respectively; tubules are assigned to the region with which they are in contact for ≥50% of their inner stripe (IS) length. E: Po2 profiles in the interstitium of the 4 regions. Vertical dotted lines mark boundary between outer stripe (OS) and IS; x/L, ratio of axial coordinate to total length of OM.
Fig. 4.
Fig. 4.
A–D: O2 flow in regions, tubules, and vasa recta. Notation is analogous to that in Fig. 3. E: HbO2 flow in LDV RBCs.
Fig. 5.
Fig. 5.
Na+ concentration (CNa) profiles in tubules (A) and vessels (B) along the corticomedullary axis. Fluid CNa increases in all tubules and vessels along the corticomedullary axis, except along the prebend segments of the SDL and along the SAV near the OM-IM boundary.
Fig. 6.
Fig. 6.
Diffusive and advective interregion O2 fluxes, taken positive into a region. AD: regions R1–R4, respectively.
Fig. 7.
Fig. 7.
Interstitial area (×10−6 cm2) in regions R1–R4.
Fig. 8.
Fig. 8.
Na+ reabsorption along SAL (A) and LAL (B) driven by aerobic (solid line) and anaerobic (dashed line) metabolism, with the assumption that in medullary thick ascending limbs (mTALs), glycolysis provides significant energy at low Po2 (Eqs. 20 and 21). In the outer stripe, where mTAL luminal Po2 is sufficiently high, all Na+ active transport is oxidative.

References

    1. Adair GS The hemoglobin system. VI. The oxygen dissociation curve of hemoglobin. J Biol Chem 63: 529–545, 1925.
    1. Baxley P, Hellums J. A simple model for simulation of oxygen transport in the microcirculation. Ann Biomed Eng 11: 401–416, 1983. - PubMed
    1. Brezis M, Dinour D, Greenfeld Z, Rosen S. Susceptibility of Henle's loop to hypoxic and toxic insults. Adv Nephrol Necker Hosp 20: 41–56, 1991. - PubMed
    1. Brezis M, Heyman SN, Epstein FH. Determinants of intrarenal oxygenation. II. Hemodynamic effects. Am J Physiol Renal Fluid Electrolyte Physiol 267: F1063–F1068, 1994. - PubMed
    1. Brezis M, Rosen S, Silva P, Epstein F. Renal ischemia: a new perspective. Kidney Int 26: 375–383, 1984. - PubMed

Publication types

MeSH terms

LinkOut - more resources