

Impact of persistent cortical activity (up States) on intracortical and thalamocortical synaptic inputs
- PMID: 19403750
- PMCID: PMC2712261
- DOI: 10.1152/jn.00126.2009
Impact of persistent cortical activity (up States) on intracortical and thalamocortical synaptic inputs
Abstract
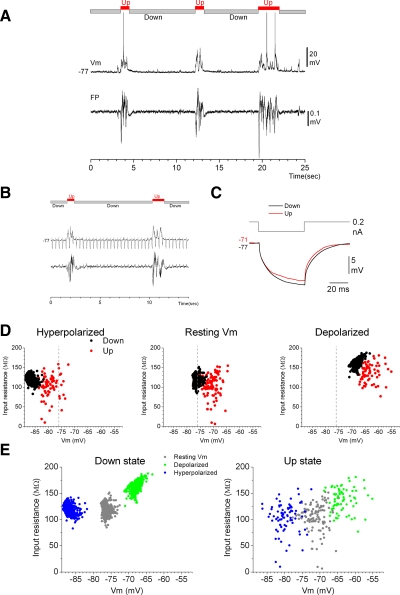
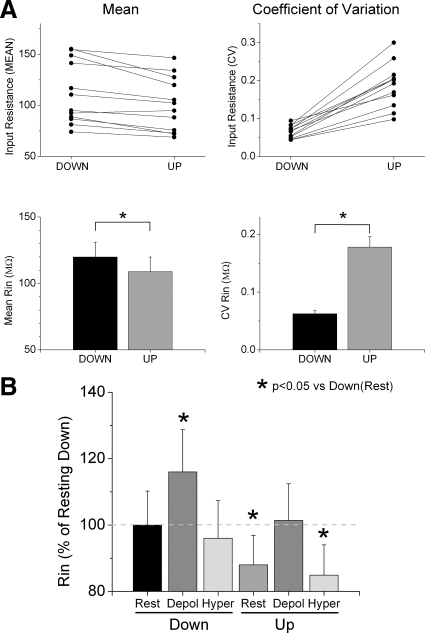
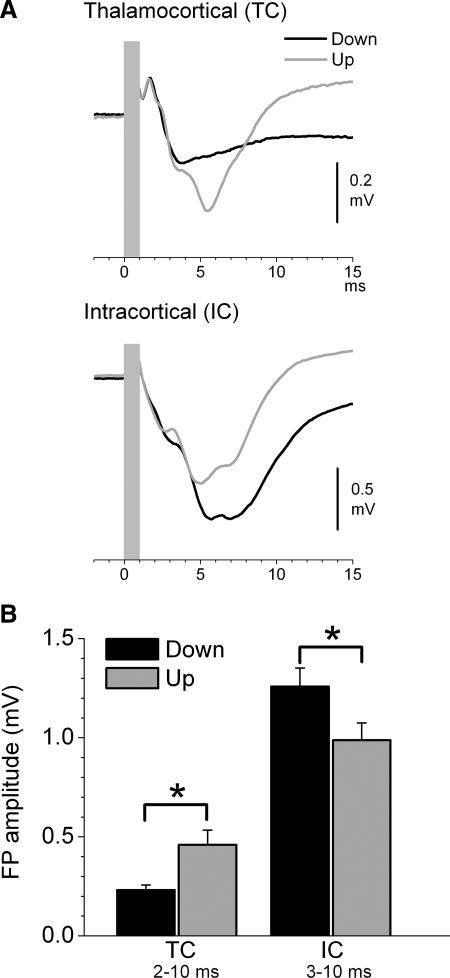
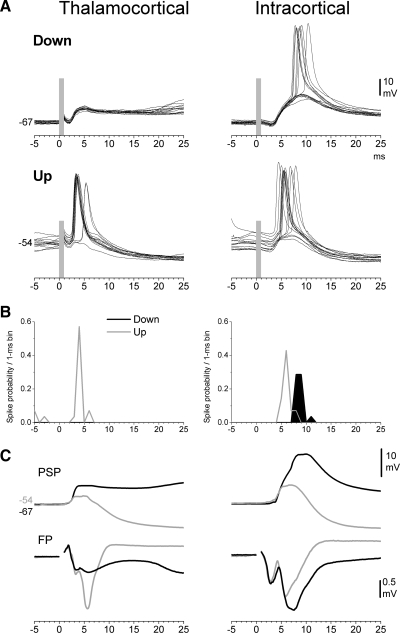
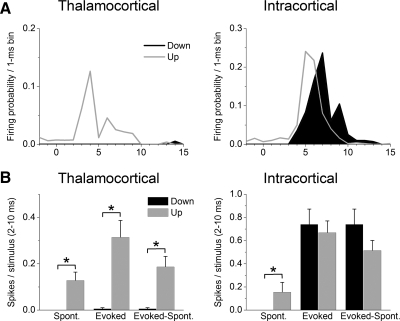
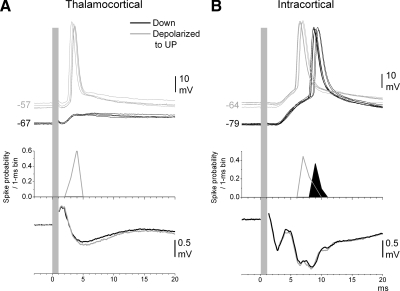
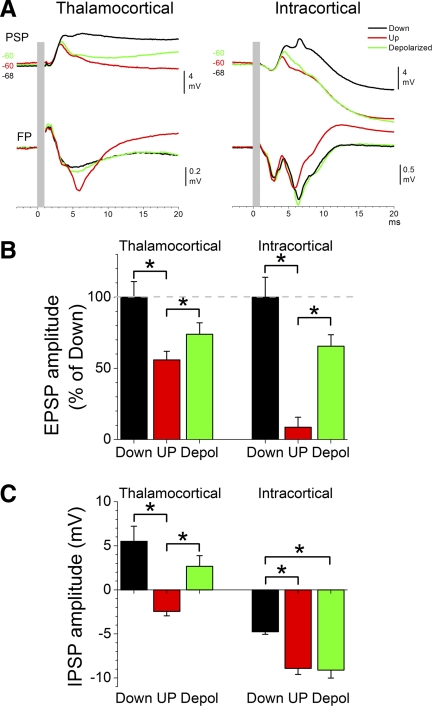
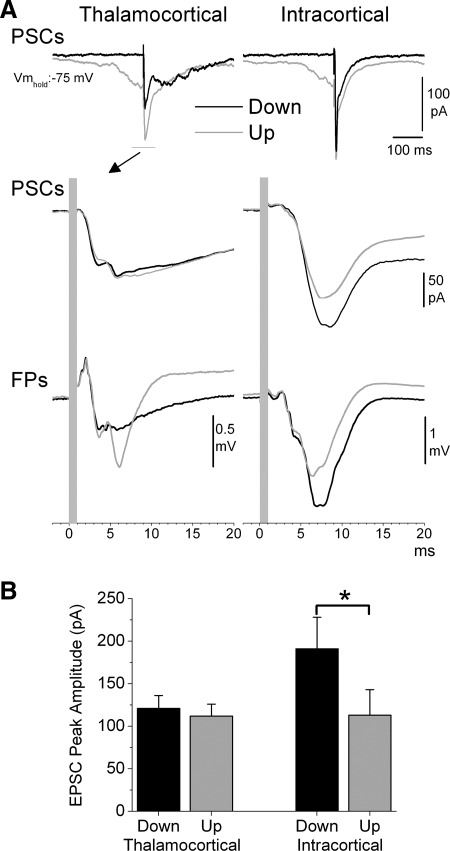
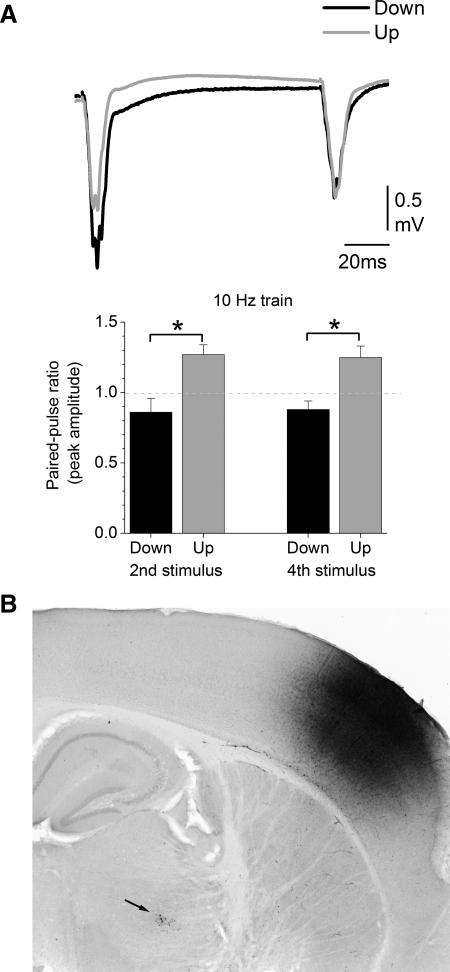
The neocortex generates short epochs of persistent activity called up states, which are associated with changes in cellular and network excitability. Using somatosensory thalamocortical slices, we studied the impact of persistent cortical activity during spontaneous up states on intrinsic cellular excitability (input resistance) and on excitatory synaptic inputs of cortical cells. At the intrinsic excitability level, we found that the expected decrease in input resistance (high conductance) resulting from synaptic barrages during up states is counteracted by an increase in input resistance due to depolarization per se. The result is a variable but on average relatively small reduction in input resistance during up states. At the synaptic level, up states enhanced a late synaptic component of short-latency thalamocortical field potential responses but suppressed intracortical field potential responses. The thalamocortical enhancement did not reflect an increase in synaptic strength, as determined by measuring the evoked postsynaptic current, but instead an increase in evoked action potential (spike) probability due to depolarization during up states. In contrast, the intracortical suppression was associated with a reduction in synaptic strength, apparently driven by increased presynaptic intracortical activity during up states. In addition, intracortical suppression also reflected a reduction in evoked spike latency caused by depolarization and the abolishment of longer-latency spikes caused by stronger inhibitory drive during up states. In conclusion, depolarization during up states increases the success of excitatory synaptic inputs to reach firing. However, activity-dependent synaptic depression caused by increased presynaptic firing during up states and the enhancement of evoked inhibitory drive caused by depolarization suppress excitatory intracortical synaptic inputs.
Figures
Similar articles
-
Thalamocortical Up states: differential effects of intrinsic and extrinsic cortical inputs on persistent activity.J Neurosci. 2007 Apr 18;27(16):4261-72. doi: 10.1523/JNEUROSCI.0003-07.2007. J Neurosci. 2007. PMID: 17442810 Free PMC article.
-
Synaptic cooperativity regulates persistent network activity in neocortex.J Neurosci. 2013 Feb 13;33(7):3151-63. doi: 10.1523/JNEUROSCI.4424-12.2013. J Neurosci. 2013. PMID: 23407969 Free PMC article.
-
Differential modulation of spontaneous and evoked thalamocortical network activity by acetylcholine level in vitro.J Neurosci. 2013 Nov 6;33(45):17951-66. doi: 10.1523/JNEUROSCI.1644-13.2013. J Neurosci. 2013. PMID: 24198382 Free PMC article.
-
Spike timing and synaptic dynamics at the awake thalamocortical synapse.Prog Brain Res. 2005;149:91-105. doi: 10.1016/S0079-6123(05)49008-1. Prog Brain Res. 2005. PMID: 16226579 Review.
-
Thalamocortical synaptic connections: efficacy, modulation, inhibition and plasticity.Rev Neurosci. 2001;12(2):159-73. doi: 10.1515/revneuro.2001.12.2.159. Rev Neurosci. 2001. PMID: 11392456 Review.
Cited by
-
A distinct class of slow (~0.2-2 Hz) intrinsically bursting layer 5 pyramidal neurons determines UP/DOWN state dynamics in the neocortex.J Neurosci. 2015 Apr 8;35(14):5442-58. doi: 10.1523/JNEUROSCI.3603-14.2015. J Neurosci. 2015. PMID: 25855163 Free PMC article.
-
Spiking in auditory cortex following thalamic stimulation is dominated by cortical network activity.Front Syst Neurosci. 2014 Sep 19;8:170. doi: 10.3389/fnsys.2014.00170. eCollection 2014. Front Syst Neurosci. 2014. PMID: 25285071 Free PMC article.
-
NMDA receptors are the basis for persistent network activity in neocortex slices.J Neurophysiol. 2015 Jun 1;113(10):3816-26. doi: 10.1152/jn.00090.2015. Epub 2015 Apr 15. J Neurophysiol. 2015. PMID: 25878152 Free PMC article.
-
Up and Down States of Cortical Neurons in Focal Limbic Seizures.Cereb Cortex. 2020 May 14;30(5):3074-3086. doi: 10.1093/cercor/bhz295. Cereb Cortex. 2020. PMID: 31800015 Free PMC article.
-
Preferential effect of isoflurane on top-down vs. bottom-up pathways in sensory cortex.Front Syst Neurosci. 2014 Oct 7;8:191. doi: 10.3389/fnsys.2014.00191. eCollection 2014. Front Syst Neurosci. 2014. PMID: 25339873 Free PMC article.
References
-
- Agmon A, Connors BW. Thalamocortical responses of mouse somatosensory (barrel) cortex in vitro. Neuroscience 41: 365–379, 1991. - PubMed
-
- Arieli A, Sterkin A, Grinvald A, Aertsen A. Dynamics of ongoing activity: explanation of the large variability in evoked cortical responses. Science 273: 1868–1871, 1996. - PubMed
-
- Bruno RM, Sakmann B. Cortex is driven by weak but synchronously active thalamocortical synapses. Science 312: 1622–1627, 2006. - PubMed
-
- Castro-Alamancos MA Short-term plasticity in thalamocortical pathways: cellular mechanisms and functional roles. Rev Neurosci 8: 95–116, 1997. - PubMed
Publication types
MeSH terms
Grants and funding
LinkOut - more resources
Full Text Sources