. 2009 Jul;102(1):132-45.
doi: 10.1152/jn.00016.2009. Epub 2009 Apr 29.

Signaling of grasp dimension and grasp force in dorsal premotor cortex and primary motor cortex neurons during reach to grasp in the monkey

Affiliations

Signaling of grasp dimension and grasp force in dorsal premotor cortex and primary motor cortex neurons during reach to grasp in the monkey

Claudia M Hendrix et al. J Neurophysiol. 2009 Jul.

Abstract

A fundamental question is how the CNS controls the hand with its many degrees of freedom. Several motor cortical areas, including the dorsal premotor cortex (PMd) and primary motor cortex (M1), are involved in reach to grasp. Although neurons in PMd are known to modulate in relation to the type of grasp and neurons in M1 in relation to grasp force and finger movements, whether specific parameters of whole hand shaping are encoded in the discharge of these cells has not been studied. In this study, two monkeys were trained to reach and grasp 16 objects varying in shape, size, and orientation. Grasp force was explicitly controlled, requiring the monkeys to exert either three or five levels of grasp force on each object. The animals were unable to see the objects or their hands. Single PMd and M1 neurons were recorded during the task, and cell firing was examined for modulation with object properties and grasp force. The firing of the vast majority of PMd and M1 neurons varied significantly as a function of the object presented as well as the object grasp dimension. Grasp dimension of the object was an important determinant of the firing of cells in both PMd and M1. A smaller percentage of PMd and M1 neurons were modulated by grasp force. Linear encoding was prominent with grasp force but less so with grasp dimension. The correlations with grasp dimension and grasp force were stronger in the firing of M1 than PMd neurons and across both regions the modulation with these parameters increased as reach to grasp proceeded. All PMd and M1 neurons that signaled grasp force also signaled grasp dimension, yet the two signals showed limited interactions, providing a neural substrate for the independent control of these two parameters at the behavioral level.


Figures

FIG. 1.
FIG. 1.
A: the reach to grasp task timeline (top) and the corresponding computer monitor display sequence (bottom). The monkey began with its hand on the start-pad while viewing a blank monitor (left). A large red rectangle on the monitor provided a “go” cue to initiate the reach-to-grasp (middle). Simultaneously, blue bars signaled the level of grasp force required at the target object. The central red slider provided feedback on the exerted grasp force (right). The task epochs were 1) baseline epoch during the initial start-pad hold, 2) premovement epoch starting 300 ms before movement onset, 3) reach epoch beginning on movement onset and ending with grasp initiation, and 4) grasp epoch beginning with grasp initiation and maintaining the grasp (1,200 ms). B: 4 object classes (cubes, rectangular prisms, poly-sided prisms, and cylinders) were presented with the x-y plane parallel to the frontal plane of the monkey. Grasp dimensions measured along the z-axis (e.g., as shown by the white line segment on object 6) were 1, 2, 2.8, 3, 3.3, 4, or 4.5 cm. The cubes had volumes of 1, 8, 27, and 64 cm3, the rectangular solids had a volume of 18 cm3 (3 were 4.5 × 2 × 2 cm and 2 were 2 × 3 × 3 cm), and the poly-sided prisms and cylinders were 3 × 3 cm (length × diameter). The poly-sided prisms had 6, 8, 10, or 12 sides.
FIG. 2.
FIG. 2.
AC: cortical surface maps of reconstructed locations of microelectrode penetrations for the left motor cortical chamber in monkey G (A) and the left (B) and right (C) in monkey L. Histology and intracortical microstimulation (ICMS) results were used to classify dorsal premotor cortex (PMd; black, ≥25 μA ICMS) and and primary motor cortex (M1; gray, <25 μA ICMS) cell recording sites. ARC, arcuate; CENT, central; PRIN, principle.
FIG. 3.
FIG. 3.
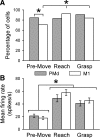
A and B: the percentage of cells (A) with significant mean firing rates (B) across epochs for PMd (gray) and M1 (white) cells. The total number of task-related cells was based on significant increases in firing relative to the baseline (paired t-test, P < 0.05 during ≥1 epoch). *Significant χ2 at P < 0.05 (A) and significant F at P < 0.05 (B).
FIG. 4.
FIG. 4.
Example of a task-related M1 cell (L061) with significant object-related firing. Histograms and force profiles represent the averaged cell firing rate and grasp force levels, respectively, across all trial repetitions for each object (2–16) and force level (1–5 N). Histograms are ordered with the repetitions of the lowest force (0.2 N) on the bottom and highest force (1.0 N) on the top for each object. In this and subsequent figures, all data were aligned on grasp initiation (time = 0). Three vertical dashed lines represent the average onset times for the premovement (P), reach, and grasp epochs.
FIG. 5.
FIG. 5.
Example of a task-related M1 cell (L048) with significant object- and force-related firing. Conventions as in Fig. 4.
FIG. 6.
FIG. 6.
A and B: example of a PMd cell (L553) with object grasp dimension related modulation. Color plots for the mean firing rate by object grasp dimension (A) and grasp force (E). B–H: mean firing rates and SE across object grasp dimension (B–D) and force level (F–H) during the premovement (B and F), reach (C and G), and grasp epochs (D and H). Post hoc linear regressions indicated that cell firing was not linearly related to object grasp dimension during the 3 epochs. Vertical lines above the color plots represent the average onset times for the premovement, reach, and grasp epochs with the SD of reach onset indicated by a horizontal bar at the top.
FIG. 7.
FIG. 7.
A and B: example of an M1 cell (L052) with object grasp dimension and force-related modulation. Color plots for the mean firing rate by object grasp dimension (A) and grasp force levels (E). B–H: mean firing rates and SE across object grasp dimension (left) and force level (right) during the premovement (B and F), reach (C and G), and grasp (D and H). Post hoc linear regressions indicated that cell firing was not linearly related to the object grasp dimension. Cell firing was linearly related to grasp force during the grasp epoch. Conventions as in Fig. 6.
FIG. 8.
FIG. 8.
Modulation related to object grasp dimension was the dominant parameter encoded in PMd and M1 cells. Percentage of PMd (gray) and M1 (white) cells with significant object grasp dimension (A) and force (C) effects across epochs. Corresponding R2 for object grasp dimension (B) and force (D) parameters. *Significant χ2 at P < 0.05 (A and C) and significant F at P < 0.05 (B).
FIG. 9.
FIG. 9.
AC: example of a PMd cell (L056) with predominant object-related encoding. The model (A) and partial R2 profiles for grasp dimension (B) and grasp force (C) parameters. Above each bar plot a raster display indicates times at which the discharge was significantly correlated with the model parameter. A time bin was considered significant only if the model or partial R2s remained significant for 83 ms. D and E: color plots of the firing rates over time, averaged across objects (D) and force levels (E). Vertical dashed lines in the bar plots represent the average onset times for the premovement, reach, and grasp epochs with the SD indicated by a horizontal bar at the top.
FIG. 10.
FIG. 10.
A–C: example of an M1 cell (L518) with object- and force-related encoding. The model (A) and partial R2 profiles for grasp dimension (B) and grasp force (C). D and E: color plots of the firing rates over time, averaged across grasp dimensions (D) and force as levels (E). Conventions as in Fig. 9.
FIG. 11.
FIG. 11.
M1 cells (gray) were more actively engaged during reach-to-grasp than PMd cells (black). A–C: the percentage of cells with significant R2model (A) for monkeys G and L and corresponding percentages of partial R2gd (B) and R2force (C) parameters. D–F: averaged R2model (D) and corresponding averaged partial R2gd (E) and R2force (F) parameters. First vertical line represents the average onset time for the premovement (P; ±SD) and the 2nd line represents the onset of grasp.

Similar articles

Cited by

References

    1. Ashe J, Georgopoulos AP. Movement parameters and neural activity in motor cortex and area 5. Cereb Cortex 4: 590–600, 1994. - PubMed
    1. Begliomini C, Caria A, Grodd W, Castiello U. Comparing natural and constrained movements: new insights into the visuomotor control of grasping. PLoS ONE 2: e1108, 2007. - PMC - PubMed
    1. Biegstraaten M, Smeets JB, Brenner E. The relation between force and movement when grasping an object with a precision grip. Exp Brain Res 171: 347–357, 2006. - PubMed
    1. Bortoff GA, Strick PL. Corticospinal terminations in two new-world primates: further evidence that corticomotoneuronal connections provide part of the neural substrate for manual dexterity. J Neurosci 13: 5105–5118, 1993. - PMC - PubMed
    1. Boudreau MJ, Brochier T, Pare M, Smith AM. Activity in ventral and dorsal premotor cortex in response to predictable force-pulse perturbations in a precision grip task. J Neurophysiol 86: 1067–1078, 2001. - PubMed

Publication types

LinkOut - more resources