Comparative Study
. 2009 Apr 29;29(17):5411-24.
doi: 10.1523/JNEUROSCI.3503-08.2009.

p75 and TrkA signaling regulates sympathetic neuronal firing patterns via differential modulation of voltage-gated currents

Affiliations
Comparative Study

p75 and TrkA signaling regulates sympathetic neuronal firing patterns via differential modulation of voltage-gated currents

Jason A Luther et al. J Neurosci. .

Abstract

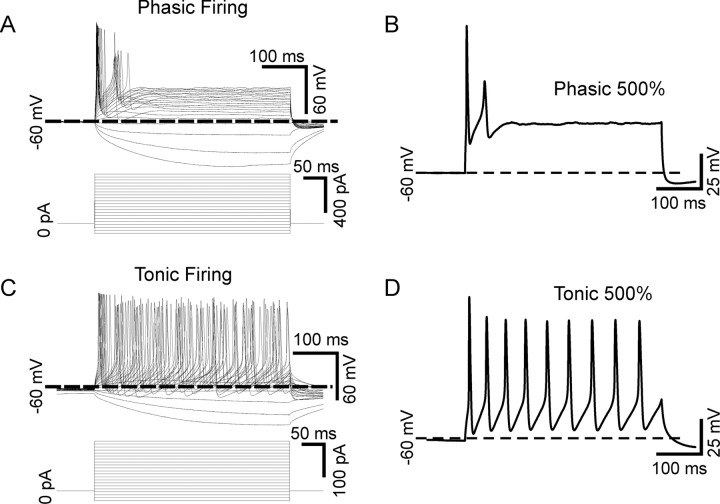
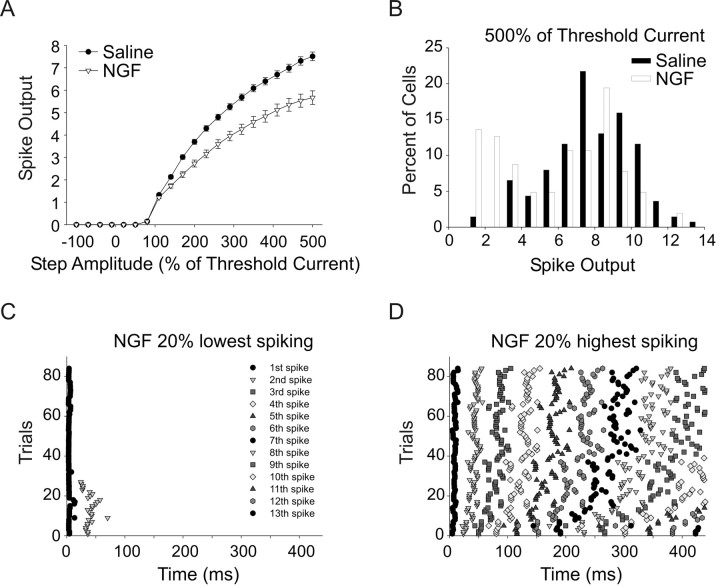
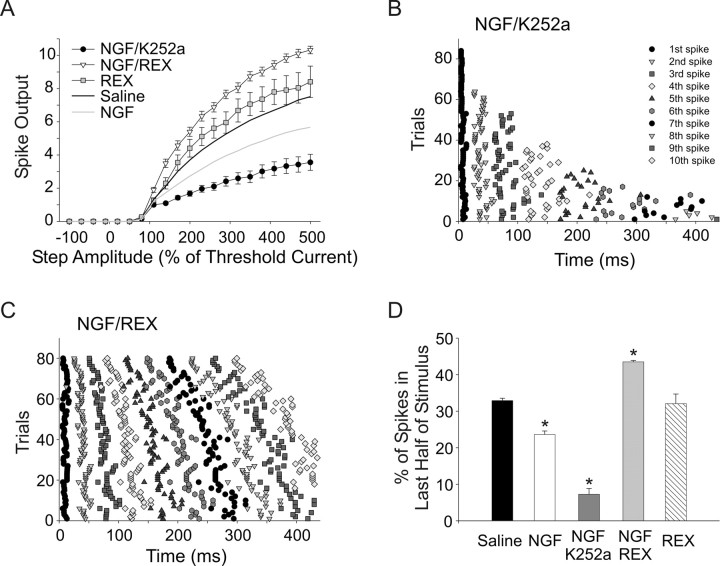
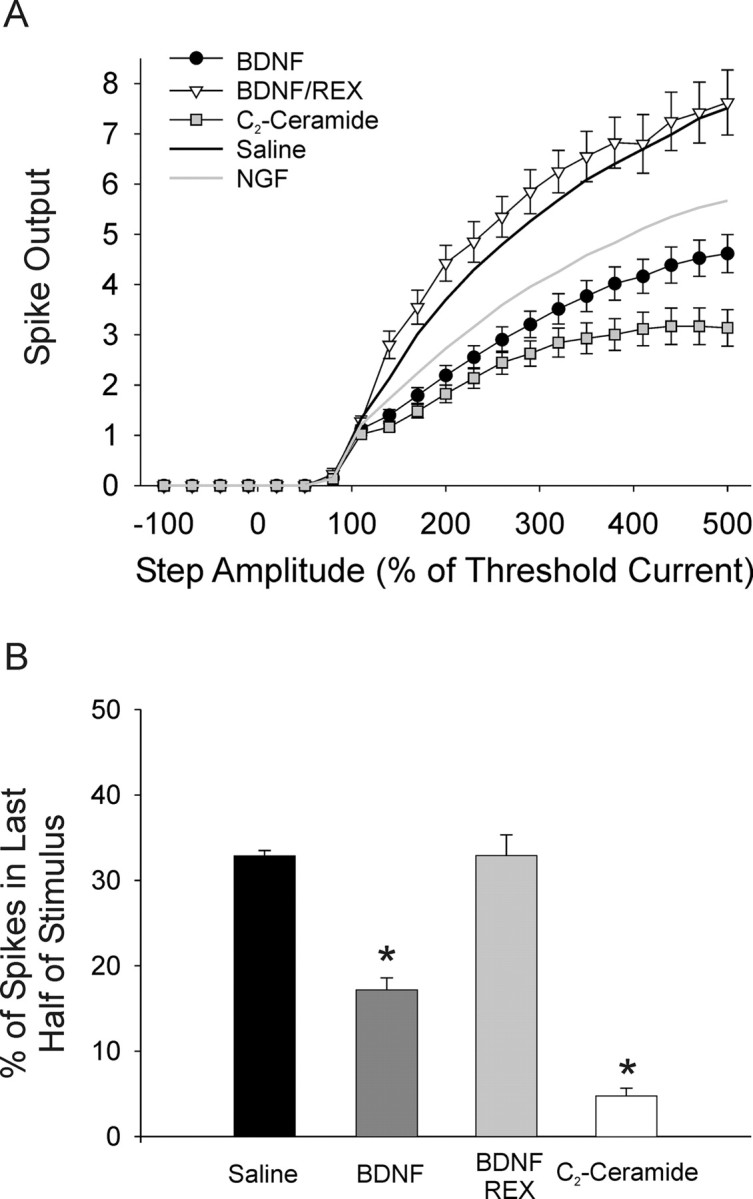
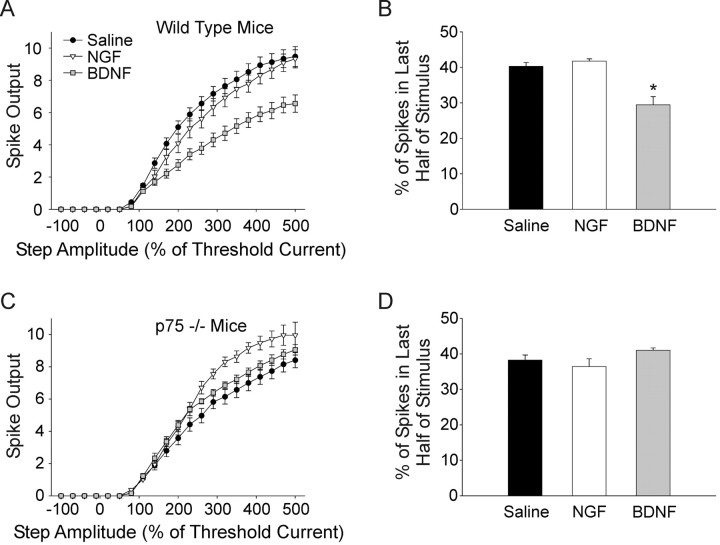
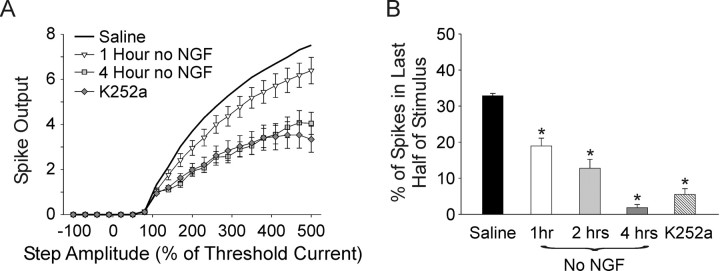
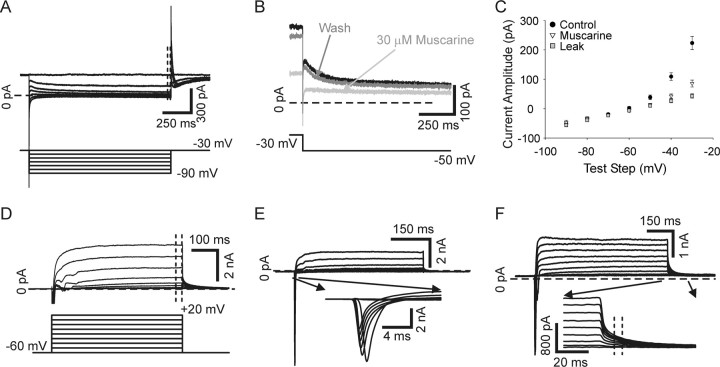
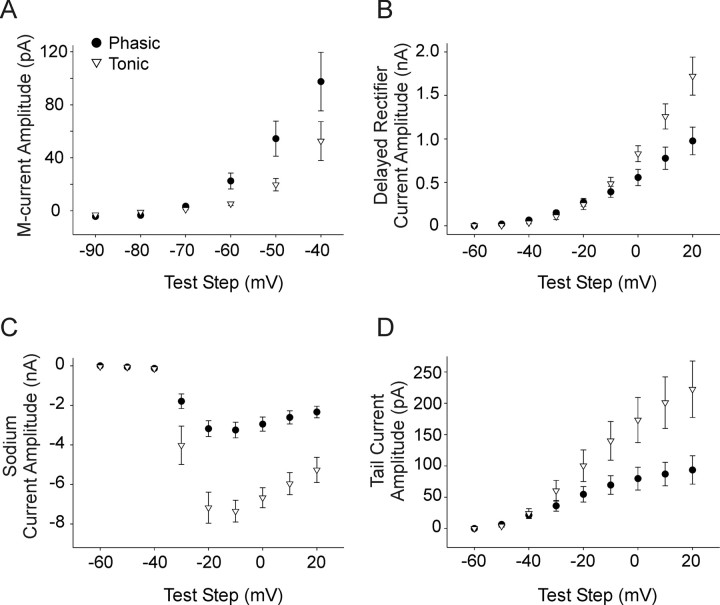
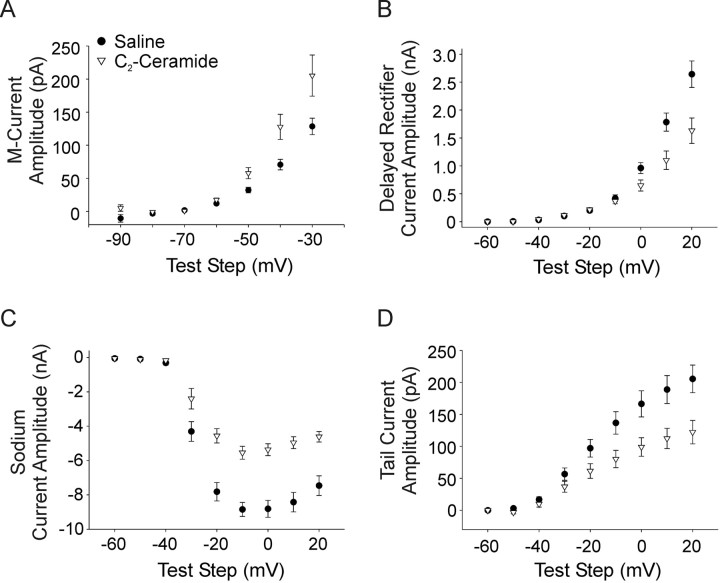
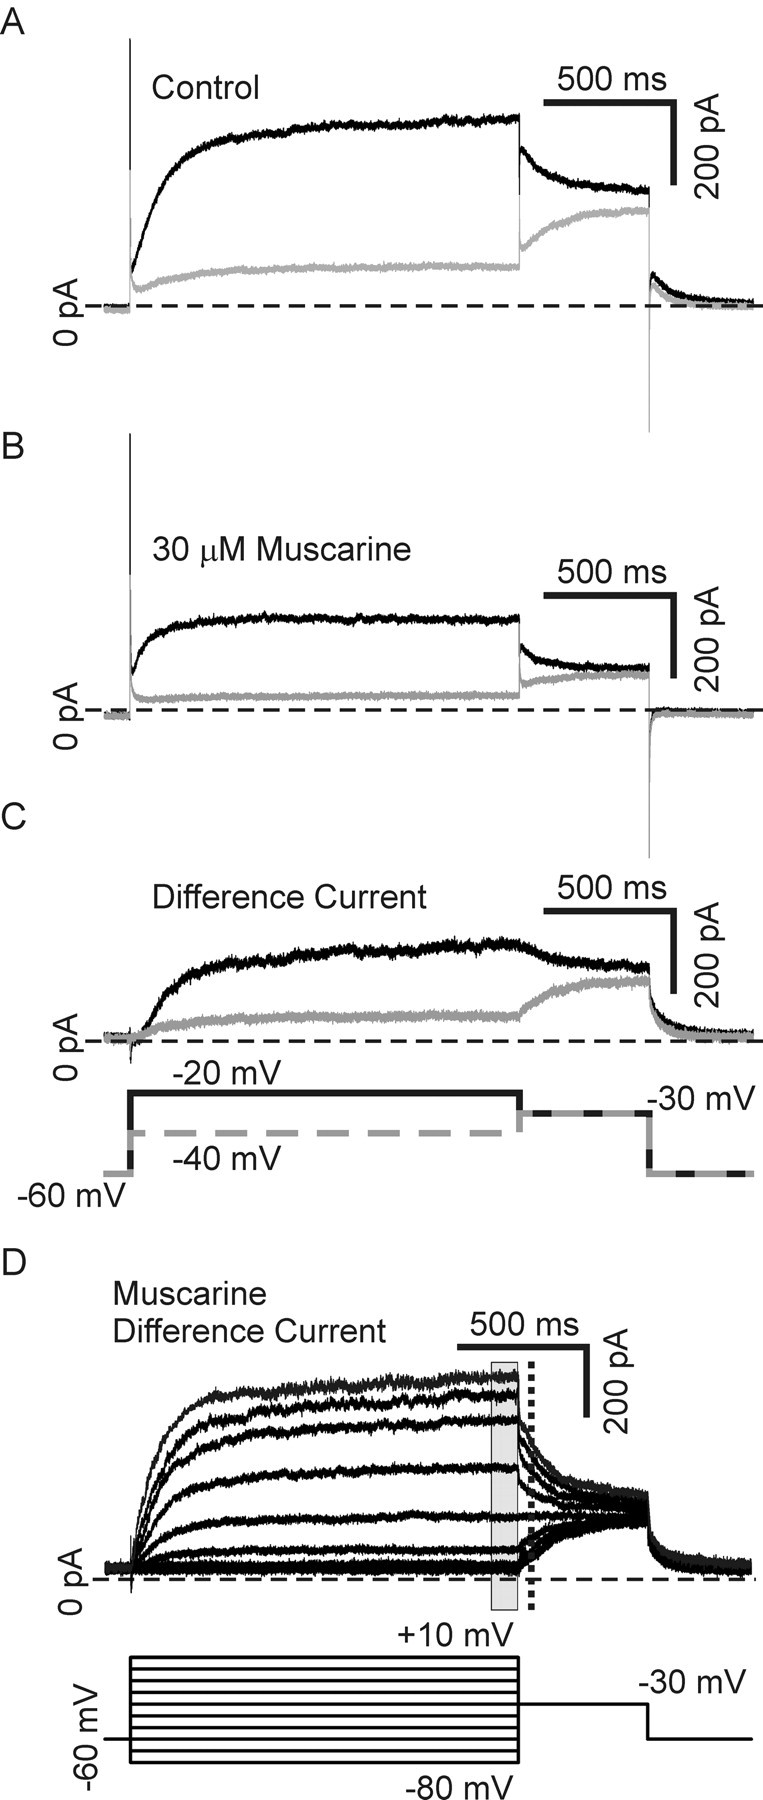
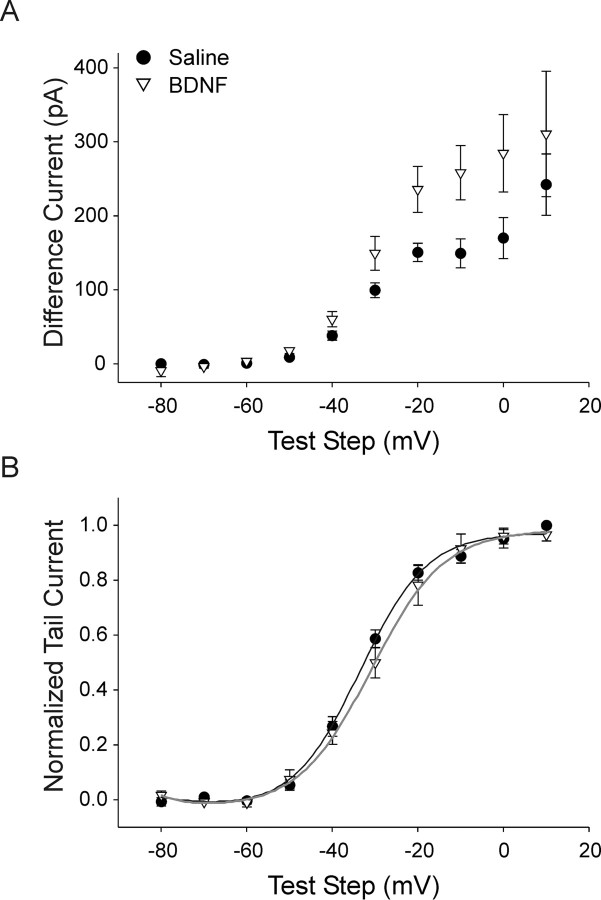
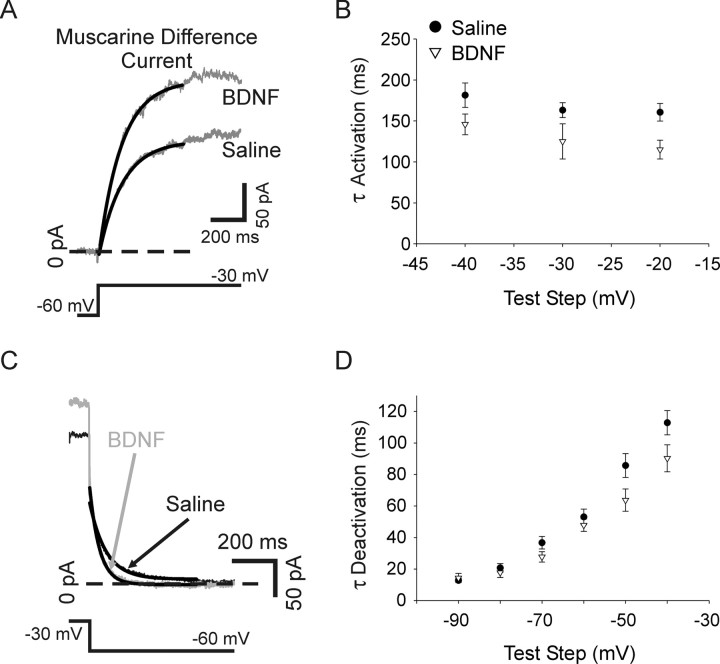
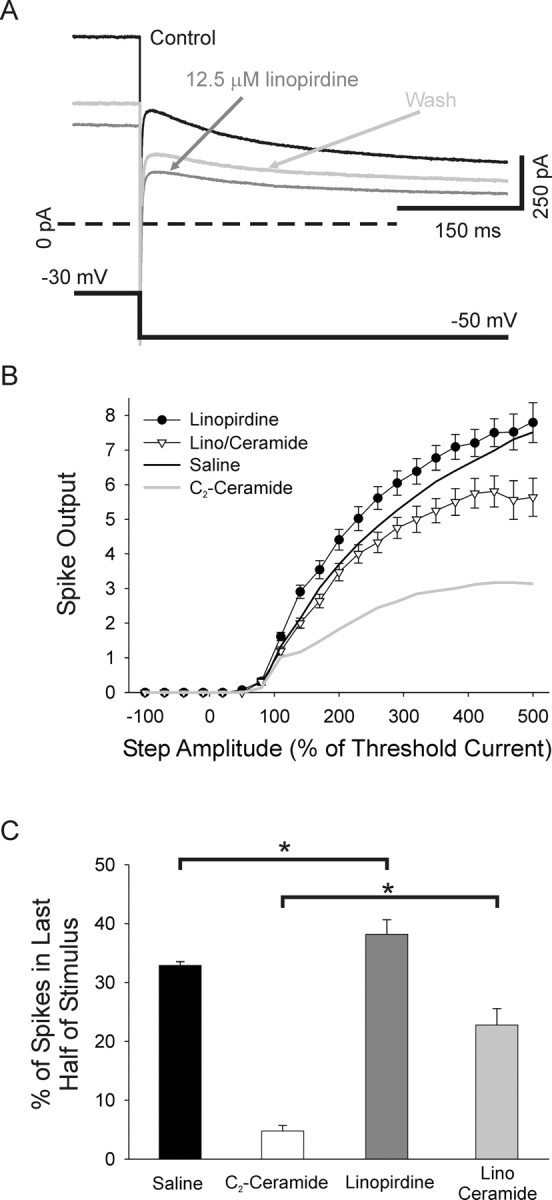
Neurotrophins such as nerve growth factor (NGF) and brain-derived neurotrophic factor (BDNF) act through the tropomyosin-related receptor tyrosine kinases (Trk) and the pan-neurotrophin receptor (p75) to regulate complex developmental and functional properties of neurons. While NGF activates both receptor types in sympathetic neurons, differential signaling through TrkA and p75 can result in widely divergent functional outputs for neuronal survival, growth, and synaptic function. Here we show that TrkA and p75 signaling pathways have opposing effects on the firing properties of sympathetic neurons, and define a mechanism whereby the relative level of signaling through these two receptors sets firing patterns via coordinate regulation of a set of ionic currents. We show that signaling through the p75 pathway causes sympathetic neurons to fire in a phasic pattern showing marked accommodation. Signaling through the NGF-specific TrkA, on the other hand, causes cells to fire tonically. Neurons switch rapidly between firing patterns, on the order of minutes to hours. We show that changes in firing patterns are caused by neurotrophin-dependent regulation of at least four voltage-gated currents: the sodium current and the M-type, delayed rectifier, and calcium-dependent potassium currents. Neurotrophin release, and thus receptor activation, varies among somatic tissues and physiological state. Thus, these data suggest that target-derived neurotrophins may be an important determinant of the characteristic electrical properties of sympathetic neurons and therefore regulate the functional output of the sympathetic nervous system.


Figures

Figure 1.
Figure 1.
Phasic and tonic firing patterns in sympathetic neurons. A, Superimposed voltage traces recorded in current clamp from a sympathetic neuron firing in a phasic pattern (top). The neuron responded to 440 ms current pulses ranging from −100% of threshold current amplitude up to 500% of threshold current (shown below). This cell responded to all stimuli by firing one or two action potentials near the beginning of the pulse and then falling silent. B, The voltage response of the cell shown in A in response to a 500% of threshold current stimulus. C, Superimposed voltage traces recorded from a tonic cell (top) show that this cell fired repetitively throughout the duration of all stimuli above the threshold current. D, The voltage response of the cell shown in B in response to a 500% of threshold current stimulus.
Figure 2.
Figure 2.
NGF induces phasic firing in a subpopulation of sympathetic neurons. A, A plot of the number of spikes fired against test step amplitude shows that bath-applied NGF (50 ng/ml; 15–120 min; see Materials and Methods) significantly decreased the mean spike output over the stimulus range tested (p < 0.001, two-way ANOVA followed by the Tukey test, n = 138 and n = 103 for saline and NGF, respectively). B, A histogram plot of spike output in response to a 500% of threshold stimulus shows that the mean population decrease in firing in NGF was due to a shift to lower spike output in a subpopulation of cells. C, A raster plot of spike times relative to stimulus onset elicited with a 500% of threshold stimulus shows that the 20% lowest spike output cells in NGF fired in a phasic pattern, i.e., with a burst of spikes near the beginning of the stimulus (21 cells, 4 trials each). D, A raster plot of spike times elicited with a 500% of threshold stimulus for the 20% highest spike NGF cells showing that these cells fired tonically (21 cells, 4 trials each).
Figure 3.
Figure 3.
NGF activation of p75 and TrkA receptors differentially regulates firing patterns. NGF activates both p75 and TrkA receptors in sympathetic neurons. Coapplication of NGF with the TrkA blocker K252a or the p75-blocking antibody REX was used to selectively activate each signaling pathway. A, Plots of spike output versus stimulus amplitude show that NGF with the TrkA antagonist (200 nm K252a, filled circles) resulted in a significant decrease in spike output compared with saline (black line) or NGF alone (gray line; n = 22, p < 0.01, two-way ANOVA followed by the Tukey test). Application of NGF with the p75 function-blocking antibody (REX 1:700, open triangles) resulted in a significant increase in spike output compared with saline or NGF alone (n = 20, p < 0.01, two-way ANOVA followed by the Tukey test). The REX antibody applied alone had no significant effect (gray squares, n = 28). B, A raster plot of spike times elicited with a 500% of threshold stimulus shows that in NGF/K252a 85% of cells (18/21) fired five or fewer spikes occurring within the first half of the stimulus, showing a phasic pattern (n = 21, 4 trials each). C, A raster plot of spike times elicited with a 500% of threshold stimulus showing that NGF/REX promoted tonic firing (n = 20, 4 trials each). D, We used the percentage of spikes occurring in the second half of the stimulus to provide a measure of phasic and tonic firing. A bar plot shows the percentage of spikes occurring in the second half of the stimulus for the different treatment groups. Neurons in NGF and, to a greater extent, NGF/K252a fired fewer second-half spikes compared with saline (p < 0.05, all three groups different, Kruskal–Wallis ANOVA on ranks followed by Dunn's test). NGF/REX caused a significant increase in second-half spikes compared with saline and NGF alone (p < 0.05, all three groups different, Kruskal–Wallis ANOVA on ranks followed by Dunn's test). REX alone was not different from saline.
Figure 4.
Figure 4.
Activation of p75 promotes phasic firing. BDNF is a p75-specific ligand in sympathetic neurons and C2-ceramide mimics a second messenger generated by p75 activation. A, Plots of spike output versus stimulus amplitude show that bath application of 100 ng/ml BDNF (filled circles, n = 47) caused a significant decrease in spike output compared with saline (black line) or NGF alone (gray line; p < 0.001, two-way ANOVA followed by the Tukey test). The p75 antagonist, REX, blocked this effect (open triangles, n = 10). C2-ceramide, 25 μm, also significantly decreased spike output compared with both saline and NGF alone (gray squares, n = 47; p < 0.01, two-way ANOVA followed by the Tukey test). B, Bar plots of the percentage of spikes in the second half of the stimulus shows that both BDNF (dark gray bar) and C2-ceramide (open bar) significantly induced phasic firing in sympathetic neurons (p < 0.05, Kruskal–Wallis ANOVA on ranks followed by Dunn's test). The p75 antagonist, REX, blocked this effect of BDNF (light gray bar).
Figure 5.
Figure 5.
NGF and BDNF differentially regulate firing in wild-type and p75 knock-out mouse neurons. A, A plot of spike output versus stimulus strength for cultured wild-type mouse sympathetic neurons shows that, similar to rats, BDNF (gray squares, n = 14) significantly decreased spiking compared with saline (filled circles, n = 26; p < 0.001, two-way ANOVA followed by the Tukey test). Unlike in rat neurons NGF did not cause a significant decrease in spike output (open triangles). B, A bar plot of the percentage of spikes occurring in the second half of the stimulus shows that BDNF (gray bar) significantly promoted phasic firing in wild-type neurons (p < 0.05, Kruskal–Wallis ANOVA on ranks followed by Dunn's test), but NGF showed no effect (open bar). C, A plot of spike output versus stimulus amplitude in cultured p75 knock-out mouse neurons shows that in contrast to wild-type cells, BDNF (gray squares, n = 9) did not elicit a decrease in spiking compared with saline (filled circles, n = 16). NGF on the other hand, significantly increased spiking (open triangles, n = 13; p < 0.01, one-way ANOVA followed by the Tukey test), although there was no significant effect on the percentage of spikes occurring in the second half of the stimulus (D).
Figure 6.
Figure 6.
Baseline TrkA activity promotes tonic firing under control saline conditions. A, Growth medium contains a low concentration of NGF (5 ng/ml) needed for cell survival. A plot of spike output versus stimulus amplitude shows that removal of residual NGF with TrkA-Ig before recording progressively decreased spiking with length of time in no NGF (open triangles, 1 h no NGF, n = 18; gray squares, 4 h no NGF, n = 10; black line, saline without prior removal). Application of a TrkA antagonist (200 nm K252a, gray diamonds, n = 17) without depletion of residual NGF caused a decrease in spiking comparable to 4 h with no NGF (all groups different except 4 h no NGF vs K252a, p < 0.05, two-way ANOVA followed by the Tukey test). B, A bar plot of the percentage of spikes occurring in the second half of the stimulus shows that NGF withdrawal progressively induced phasic firing with increased time in no NGF. K252a applied without prior removal of residual NGF also significantly reduced second half spikes (saline different from all other groups, and 1 h different from 4 h and K252a, p < 0.05, Kruskal–Wallis ANOVA on ranks followed by Dunn's test).
Figure 7.
Figure 7.
Voltage-clamp protocols used to examine four currents in sympathetic neurons. A, Raw current traces recorded in voltage clamp of the non-inactivating M-type potassium current in the presence of 250 nm tetrodotoxin to block sodium current (top traces). The M-current was examined by holding cells at −30 mV and making hyperpolarizing test steps (−40 to −90 mV, bottom traces, 1500 ms, bottom). The outward current decreased according to the voltage dependence of the M-current channels and was measured over the last 25 ms of the test step (dashed lines, top). B, Current traces recorded in voltage clamp evoked with voltage steps from −30 mV to −50 mV show that 30 μm muscarine chloride, an M-current antagonist, reversibly inhibited current evoked by this protocol. C, Plots of M-current amplitude, measured as described for A, versus test step show that most (80–90%) of the current was blocked with 30 μm muscarine chloride (filled circles versus open triangles), suggesting that the M-current is relatively well isolated by this protocol. Leak current is shown (gray squares) determined by p/10 protocol. D, The delayed rectifier current (top traces) was examined by giving cells depolarizing steps (−50 to +20 mV, bottom traces, 500 ms) from a −60 mV holding potential. The delayed rectifier was measured over the last 25 ms of the test step (dashed lines, top). E, The inward sodium current, shown in inset, was activated using the same voltage protocol as in B. The sodium current was measured at peak for each test step. F, The calcium-activated potassium current was activated using the same voltage protocol shown in B. It was measured as a tail current at test step offset where indicated in the inset (dashed lines). Traces in D, E, and F were leak subtracted using p/10 protocols.
Figure 8.
Figure 8.
Phasic and tonic neurons express different levels of four voltage-gated currents. Neurons were recorded from in NGF and identified as either tonic or phasic in current clamp before switching to voltage clamp to record four ionic currents. A, A plot of current amplitude versus voltage test step shows that the M-current was significantly smaller in tonic neurons (open triangles, n = 9) compared with phasic neurons (filled circles, n = 10) under identical experimental conditions (50 ng/ml NGF, p < 0.05, two-way ANOVA followed by the Tukey test). B, A current–voltage plot shows that the delayed rectifier current was significantly smaller in phasic neurons compared with tonic neurons for voltage steps depolarized to 0 mV (p < 0.05, Student's t test). C, A plot of sodium current amplitude versus voltage step shows that this current was smaller in phasic neurons (p < 0.01, two-way ANOVA followed by the Tukey test). D, A plot of the tail current amplitude, used to measure calcium-dependent potassium current, versus test step amplitude showing that this current was smaller in phasic compared with tonic neurons (p < 0.05, two-way ANOVA followed by the Tukey test).
Figure 9.
Figure 9.
Varying TrkA and p75 signaling differentially regulates four voltage-gated currents. A, A plot of current amplitude versus voltage test step shows that the M-type potassium current was larger under conditions of high p75 signaling (filled circles, C2-ceramide n = 14) compared with predominant TrkA activation (open triangles, saline, see Results, n = 19; p < 0.05, two-way ANOVA, followed by the Tukey test). B, A current–voltage plot showing that the delayed rectifier current was smaller in C2-ceramide compared with saline with voltage steps depolarized to −10 mV (p < 0.05, Student's t test). C, A current–voltage plot showing that neurons expressed a smaller voltage-gated sodium current in C2-ceramide compared with saline (p < 0.01, two-way ANOVA, followed by the Tukey test). D, A plot of current density versus voltage step shows that the tail current, representative of the calcium-dependent potassium current, was smaller in C2-ceramide compared with saline (p < 0.01, two-way ANOVA, followed by the Tukey test).
Figure 10.
Figure 10.
The M-current was isolated using a muscarine subtraction protocol. A, Depolarizing voltage-steps made from a holding potential of −60 mV in the presence of 250 nm tetrodotoxin to block sodium current, elicit mixed outward currents in our neurons. Steps to −40 mV (gray) and −20 mV (black) are shown. B, Application of the M-current antagonist, 30 μm muscarine chloride, blocks the M-current while having little or no effect on other potassium currents. Steps to −40 mV (gray) and −20 mV (black) in the same cell as in A after application of muscarine are shown. C, Subtraction of traces generated in muscarine from those generated in control saline gives a difference current representing the muscarine-sensitive current: the M-current. Muscarine difference currents for the cell depicted in A and B are shown for −40 mV (gray) and −20 mV (black) steps. D, A family of muscarine difference currents generated with test steps ranging from −80 mV to +10 mV made from −60 mV in the presence of 250 nm tetrodotoxin to block sodium current. The current–voltage dependence was determined by measuring the average current at the end of the test step (gray rectangle), and the voltage dependence of activation was determined by measuring tail currents upon stepping back to −30 mV (dashed line) to normalize for driving force.
Figure 11.
Figure 11.
Activation of p75 increases M-current amplitude without altering voltage dependence of activation. A, Plots of muscarine difference current amplitude versus test step [measured over the end of the step (gray rectangle in Fig. 10D)] show that application of 100 ng/ml of the p75 agonist BDNF (open triangles, n = 6) caused an increase in M-current amplitude compared with saline (filled circles, n = 7; p < 0.05, two-way ANOVA, followed by the Tukey test). B, Plots of normalized tail current amplitude with steps back to −30 mV (measured at dashed line in Fig. 10D) show that the voltage dependence of activation of the M-current for cells recorded from in saline (n = 7) and BDNF (n = 6) did not differ (Boltzmann parameters, V½ −33.1 ± 1.2 mV vs −29.6 ± 2.3 mV and τ 7.2 ± 0.4 ms vs 8.6 ± 1.2 ms, for saline and BDNF, respectively). Boltzmann fits are shown graphed as solid lines.
Figure 12.
Figure 12.
The kinetics of activation and deactivation were not significantly altered by p75 activation. Single exponential functions (solid lines) fitted to muscarine difference currents elicited by depolarizing voltage steps to −30 mV from −60 mV for cells recorded from in saline or BDNF. B, A plot of the activation time constant (determined from exponential fits) shows no significant difference between saline (filled circles, n = 7) and BDNF (open triangles, n = 6) over test steps ranging from −40 mV to −20 mV. C, Single exponential functions (solid lines) fitted to muscarine difference currents generated with a hyperpolarizing pulse to −60 mV made from a holding potential of −30 mV for cells recorded from in saline (black) or BDNF (gray). D, A plot of the time constant of deactivation shows no significant difference between saline (filled circles, n = 7) and BDNF (open triangles, n = 6) with steps ranging from −40 mV to −90 mV.
Figure 13.
Figure 13.
M-current blockade occludes the change in firing pattern induced by p75 activation. A, Superimposed raw current traces recorded in voltage clamp from a cultured sympathetic neuron in response to steps from −30 mV to −50 mV showing that application of 12.5 μm linopirdine decreased the M-type current (black trace versus dark gray trace). This decrease partially reversed after a 15 min wash (light gray trace). B, A plot of spike output versus test step amplitude shows that application of the M-current blocker, 12.5 μm linopirdine with C2-ceramide (open triangles, n = 9), blocked the C2-ceramide-induced decrease in spike output (gray line; p < 0.01, two-way ANOVA, followed by the Tukey test). Application of linopirdine alone (filled circles) caused a trend toward increased spike output compared with saline (black line), which did not reach statistical significance. C, Bar plots of the percentage of spikes occurring in the second half of the stimulus shows that linopirdine alone significantly promoted tonic firing (filled bar versus dark gray bar; p < 0.05, Kruskal–Wallis ANOVA on ranks, followed by Dunn's test). Linopirdine decreased the ability of ceramide to promote phasic firing (ceramide, open bar compared with linopirdine/ceramide, gray bar; p < 0.05, Kruskal–Wallis ANOVA on ranks, followed by Dunn's test).

Similar articles

Cited by

References

    1. Adamson CL, Reid MA, Davis RL. Opposite actions of brain-derived neurotrophic factor and neurotrophin-3 on firing features and ion channel composition of murine spiral ganglion neurons. J Neurosci. 2002;22:1385–1396. - PMC - PubMed
    1. Aiken SP, Lampe BJ, Murphy PA, Brown BS. Reduction of spike frequency adaptation and blockade of M-current in rat CA1 pyramidal neurones by linopirdine (DuP 996), a neurotransmitter release enhancer. Br J Pharmacol. 1995;115:1163–1168. - PMC - PubMed
    1. Akopian AN, Souslova V, England S, Okuse K, Ogata N, Ure J, Smith A, Kerr BJ, McMahon SB, Boyce S, Hill R, Stanfa LC, Dickenson AH, Wood JN. The tetrodotoxin-resistant sodium channel SNS has a specialized function in pain pathways. Nat Neurosci. 1999;2:541–548. - PubMed
    1. Anderson RL, Jobling P, Gibbins IL. Development of electrophysiological and morphological diversity in autonomic neurons. J Neurophysiol. 2001;86:1237–1251. - PubMed
    1. Bamji SX, Majdan M, Pozniak CD, Belliveau DJ, Aloyz R, Kohn J, Causing CG, Miller FD. The p75 neurotrophin receptor mediates neuronal apoptosis and is essential for naturally occurring sympathetic neuron death. J Cell Biol. 1998;140:911–923. - PMC - PubMed

Publication types