Comparative Study
. 2009 Apr 29;29(17):5443-55.
doi: 10.1523/JNEUROSCI.5417-08.2009.

Drosophila Miro is required for both anterograde and retrograde axonal mitochondrial transport

Affiliations
Comparative Study

Drosophila Miro is required for both anterograde and retrograde axonal mitochondrial transport

Gary J Russo et al. J Neurosci. .

Abstract

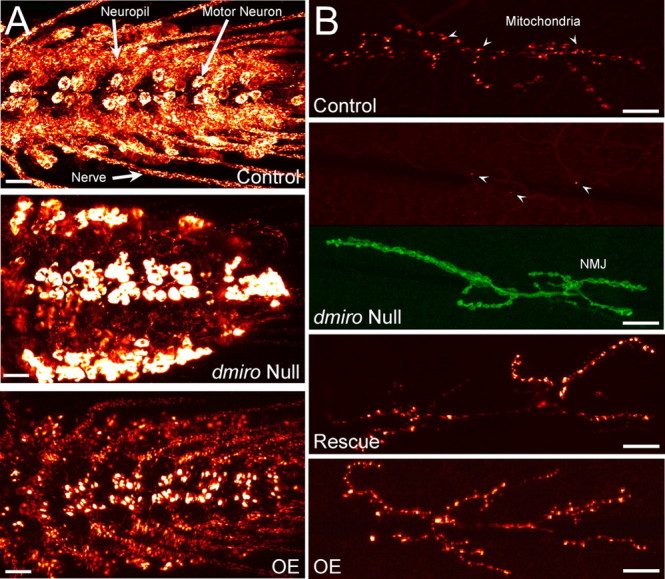
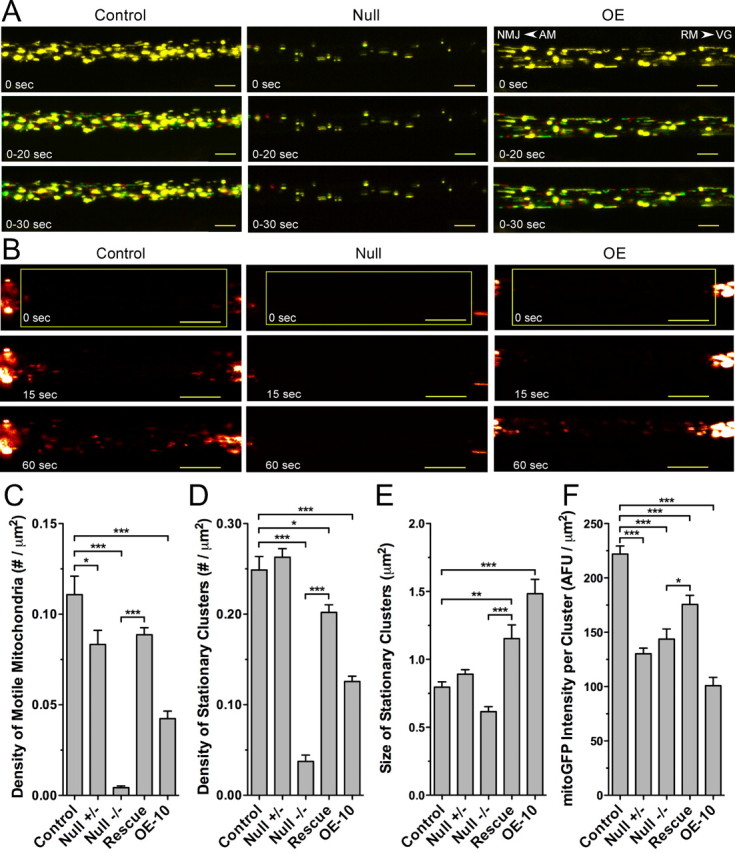
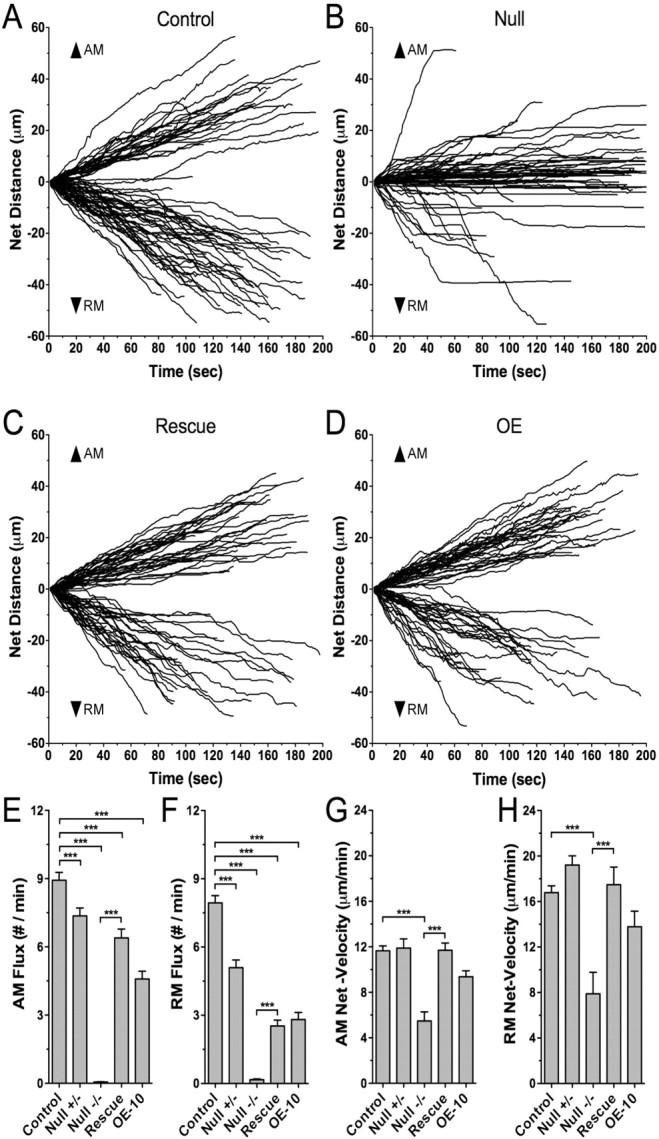
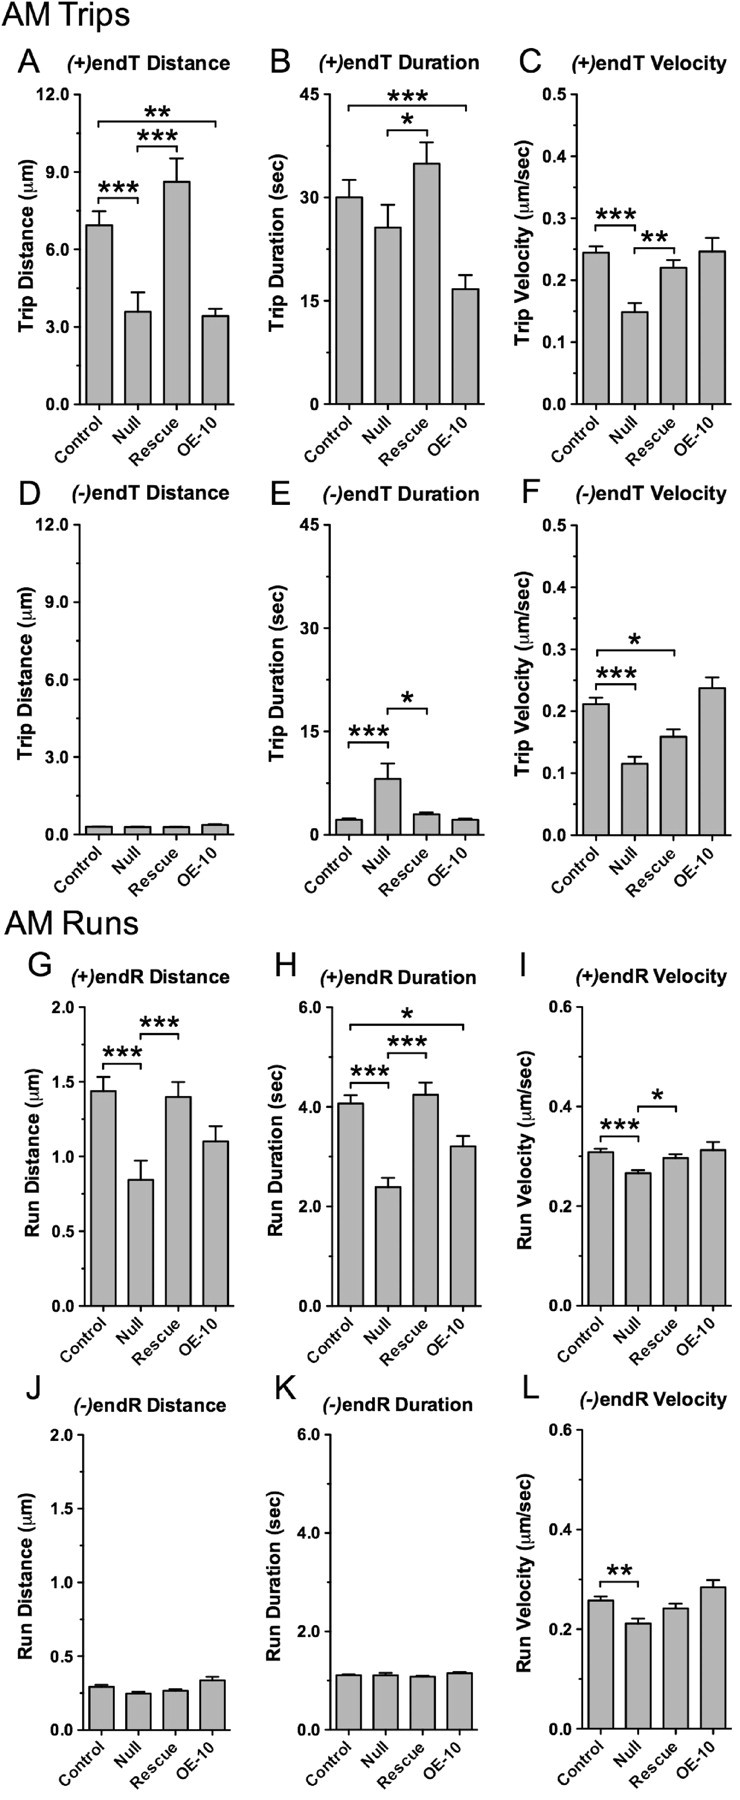
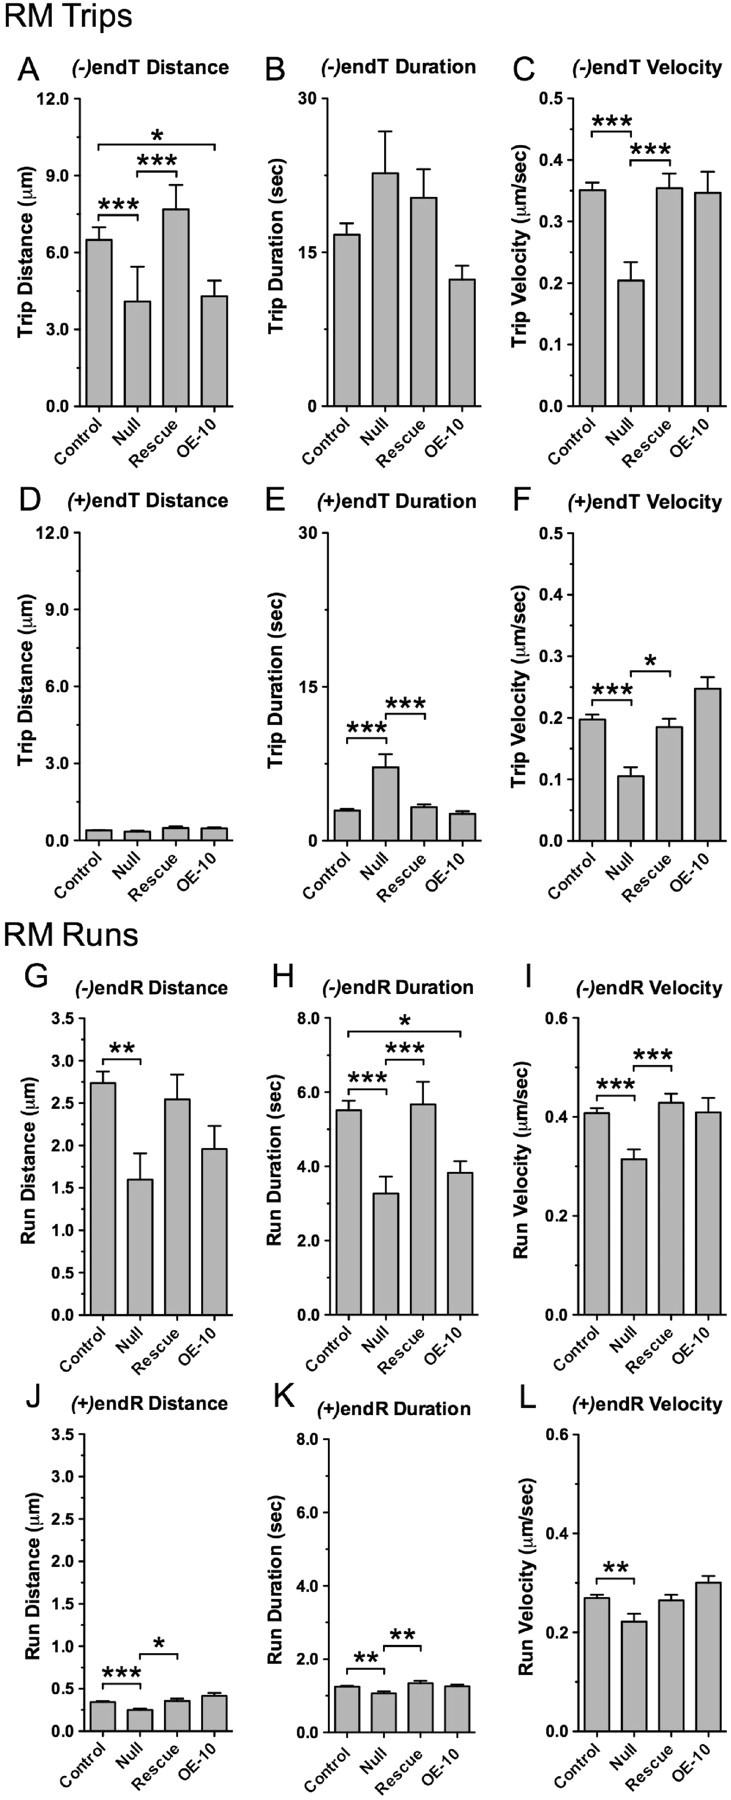
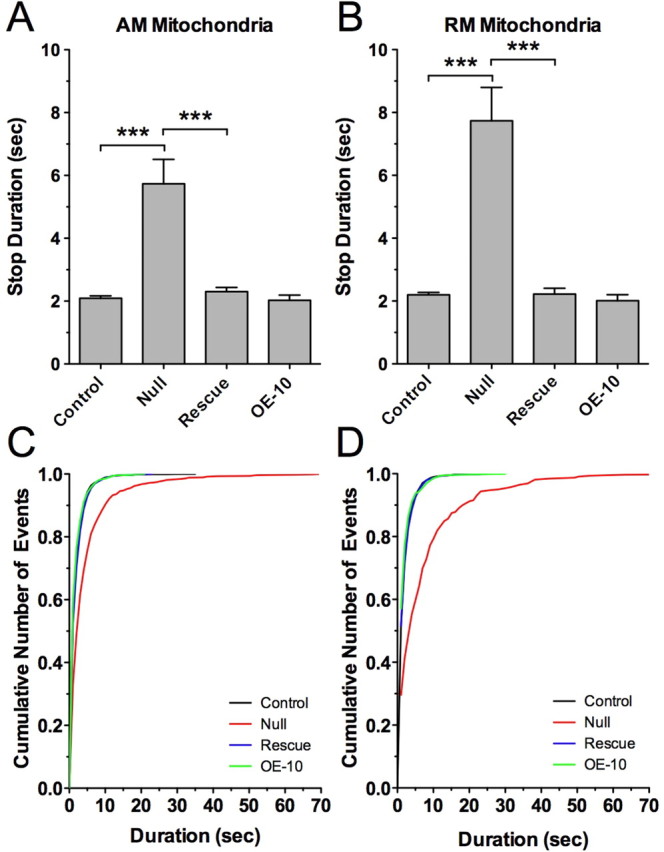
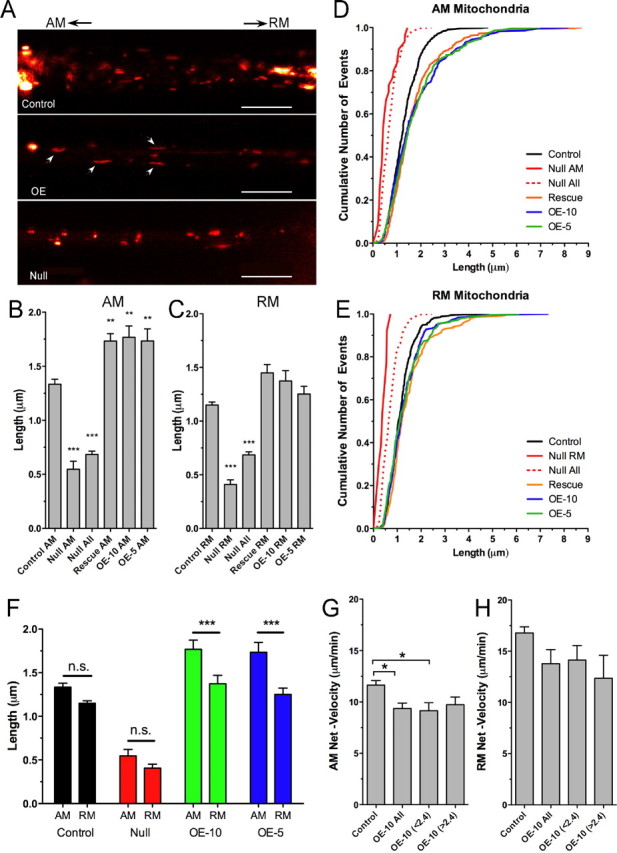
Microtubule-based transport of mitochondria into dendrites and axons is vital for sustaining neuronal function. Transport along microtubule tracks proceeds in a series of plus and minus end-directed movements that are facilitated by kinesin and dynein motors. How the opposing movements are controlled to achieve effective transport over large distances remains unclear. Previous studies showed that the conserved mitochondrial GTPase Miro is required for mitochondrial transport into axons and dendrites and serves as a Ca(2+) sensor that controls mitochondrial mobility. To directly examine Miro's significance for kinesin- and/or dynein-mediated mitochondrial motility, we live-imaged movements of GFP-tagged mitochondria in larval Drosophila motor axons upon genetic manipulations of Miro. Loss of Drosophila Miro (dMiro) reduced the effectiveness of both anterograde and retrograde mitochondrial transport by selectively impairing kinesin- or dynein-mediated movements, depending on the direction of net transport. Net anterogradely transported mitochondria exhibited reduced kinesin- but normal dynein-mediated movements. Net retrogradely transported mitochondria exhibited much shorter dynein-mediated movements, whereas kinesin-mediated movements were minimally affected. In both cases, the duration of short stationary phases increased proportionally. Overexpression (OE) of dMiro also impaired the effectiveness of mitochondrial transport. Finally, loss and OE of dMiro altered the length of mitochondria in axons through a mechanistically separate pathway. We suggest that dMiro promotes effective antero- and retrograde mitochondrial transport by extending the processivity of kinesin and dynein motors according to a mitochondrion's programmed direction of transport.


Figures

Figure 1.
Figure 1.
Distribution of GFP-tagged mitochondria in motor neurons during loss and overexpression of dMiro. Mitochondria in larval motor neurons and a few inter neurons were visualized by OK6-driven expression of mitoGFP. A, B, Shown is the mitoGFP fluorescence in ventral ganglia (A) and at larval NMJs of muscle 6/7 (B) of control, dmiro null mutants, and during OE of normal dMiro protein in an otherwise wild-type genetic background. Null mutant NMJs were counterstained with HRP-antibodies (green) to visualize neuronal membranes of the NMJ. Note that mitochondria (arrowheads) were present only rarely at dmiro null mutant NMJs (1 of 5 animals). Scale bars, 20 μm.
Figure 2.
Figure 2.
Mutations in dMiro disrupt mitochondrial transport and distribution in larval motor axons. A–F, Mitochondria of larval motor axons were labeled by Ok6-driven expression of mitoGFP. Confocal time-lapse images of a segmental larval nerve exiting the ventral ganglion were acquired at a rate of 1 s−1 without (A) or after photobleaching (B). Time intervals and direction of net AM and net RM are indicated (arrowheads in A, right top). Scale bars: A, 5 μm; B, 10 μm. Error bars represent SEM. A, Distribution of motile (red or green) and stationary mitochondrial clusters (yellow) in proximal larval motor axons of control, dmiro null mutants (Null) and during overexpression of normal dMiro (OE). B, Time lapse images showing mitochondria in larval motor axons entering a photobleached area. Genotypes as in A. Note the reduced number of mitochondria entering the photobleached region in dmiro null mutants and during dMIro OE. C, D, Average density of motile mitochondria (C) and stationary mitochondrial clusters (D) in proximal motor axons of control, heterozygous dmiro null mutants (Null −/+), homozygous dmiro null mutants (Null −/−), homozygous dmiro null mutants during expression of normal dMiro protein (Rescue), and during dMiro overexpression (OE-10). Significant differences between control and mutant genotypes as well as between Null and rescue are indicated by asterisks (p < 0.05; N > 10, one-way ANOVA). E, F, Average size (E) and normalized mitoGFP fluorescence intensity (F) of stationary mitochondrial clusters in proximal motor axons. Genotypes and significant differences are indicated as in C, D.
Figure 3.
Figure 3.
Loss of dMiro reduces the net distance and net velocity of antero- and retrograde mitochondrial transport. A–D, Each plot shows typical tracks of individual mitochondrial movements that were obtained from the analysis of time-lapse images (rate 1.006 s−1, duration 200 s) of proximal larval motor axons in control (A), dmiro null mutants (B), dmiro null mutants expressing normal dMiro protein (C), and during OE of dMiro (D). For comparison, the start of individual tracks was set to zero. Plus end-directed (upward) and minus end-directed movements (runs, downward) are defined by gaining positive or negative distance values, respectively. Note that net antero- (upward) and retrogradely (downward) transported mitochondria exhibited a mix of plus and minus end-directed runs that were separated by pauses or reversals in direction. With a few notable exceptions, dmiro null mutant mitochondria gained little net distance in either direction. E, F, Average anterograde (E) and retrograde mitochondrial flux (F) in proximal motor axons of control, heterozygous dmiro null mutants (Null −/+), homozygous dmiro null mutants (Null −/−), homozygous dmiro null mutants during expression of normal dMiro protein (Rescue), and during dMiro overexpression (OE-10). Significant differences between control and mutant genotypes as well as between Null and rescue are indicated by asterisks (p < 0.001; N > 22, one-way ANOVA). G, H, Average net velocity of net AM (G) and net RM mitochondria (H). Genotypes and significant differences are indicated as in E, F (p < 0.001; N > 19; one-way ANOVA). Error bars represent SEM.
Figure 4.
Figure 4.
Effects of dmiro mutations on the time mitochondria allocate to plus and minus end- directed mitochondrial movements. A, B, Average percentage of time AM (A) and RM mitochondria (B) allocated to plus end-directed [(+)end] or minus end-directed [(−)end] trips. Genotypes: control, homozygous dmiro null mutants (Null −/−), homozygous dmiro null mutants during expression of normal dMiro protein (Rescue), and during dMiro overexpression (OE-10). Significant differences among all genotypes are indicated by asterisks (p < 0.05, N > 18, two-way ANOVA). Error bars represent SEM. C, D, Average percentage of time AM (C) and RM mitochondria (D) allocated to plus end-directed [(+)end] runs, minus end-directed [(−)end] runs, and short stationary phases (stops). Genotypes: as in A with the addition of heterozygous dmiro null mutants (Null −/+). Significant differences are indicated (p < 0.05, N > 18, two-way ANOVA). Error bars represent SEM. E, F, Average frequency of stops for AM (E) and RM mitochondria (F). Significant differences indicated (p < 0.05, N > 18, one-way ANOVA). Genotypes are as in A and B. Error bars represent SEM. G, H, Average frequency of reversals in direction for AM (G) and RM mitochondria (H). Significant differences are indicated (p < 0.05, N > 18, one-way ANOVA). Genotypes are as in A and B. Error bars represent SEM.
Figure 5.
Figure 5.
Loss of dMiro shortens plus end-directed trips and runs during net anterograde mitochondrial transport. A–F, Average distances, durations and velocities of plus [(+)endTs] and minus end-directed trips [(−)endTs] for AM mitochondria of control, dmiro null mutants (Null), dmiro null mutants expressing normal dMiro protein (Rescue), and during overexpression of dMiro (OE-10). Asterisks show significant differences among all indicated genotypes (p < 0.05, N > 18, one-way ANOVA). Error bars represent SEM. G–L, Average distances, durations and velocities of plus [(+)endRs] and minus end-directed runs [(−)endRs] for AM mitochondria. Genotypes are as in A. Asterisks show significant differences between indicated genotypes (p < 0.05, N > 18, one-way ANOVA). Error bars represent SEM.
Figure 6.
Figure 6.
Loss of dMiro shortens minus end-directed trips and runs during net retrograde mitochondrial transport. A–F, Average distances, durations and velocities of minus [(−)endTs] and plus end-directed trips [(+)endTs] for RM mitochondria of control, dmiro null mutant motor axons (Null), dmiro null mutants expressing normal dMiro protein (Rescue), and during overexpression of dMiro (OE-10). Asterisks show significant differences among all genotypes (p < 0.05, N > 18, one-way ANOVA). Error bars represent SEM. G–L, Average distances, durations and velocities of minus [(−)endRs] and plus end-directed runs [(+)endRs] for RM mitochondria. Genotypes as in A. Asterisks show significant differences between indicated genotypes (p < 0.05, N > 18, one-way ANOVA). Error bars represent SEM.
Figure 7.
Figure 7.
Loss of dMiro increases the duration of stop periods. A, B, Average duration of stops by AM (A) and RM mitochondria (B) in control, dmiro null mutant motor axons (Null), dmiro null mutants expressing normal dMiro protein (Rescue), and during overexpression (OE-10) of normal dMiro protein. Significant differences are indicated by asterisks (p < 0.001; N <18; one-way ANOVA). Error bars represent SEM. C, D, Cumulative frequency distribution for the duration of stops by AM (C) and RM mitochondria (D) of the indicated genotypes.
Figure 8.
Figure 8.
Mutations in dMiro alter mitochondrial length. A, Confocal images of GFP-tagged mitochondria in larval motor axons of control, dmiro null mutants (Null) and during OE of dMiro. Note the altered length of mitochondria during loss and OE of dMiro. Scale bars, 10 μm. B, C, Average length of motile AM (B) and RM (C) mitochondria in larval motor axons of control, dmiro null mutants, dmiro null mutants expressing normal dMiro protein, and during OE of dMiro. OE-10 and OE-5 indicate independently derived transgenic strains. “Null All” combines the average length of motile and stationary mitochondria in dmiro null mutant axons. Asterisks indicate significant differences to control (p < 0.01; N > 20 one-way ANOVA). Error bars represent SEM. D, E, Cumulative frequency distribution for the length of AM (D) and RM mitochondria (E). Genotypes as in B. F, OE of dMiro causes a significant difference in the length of AM and RM mitochondria (p < 0.001; N > 20; two-way ANOVA). Error bars represent SEM. G, H, Average net velocity of differentially sized AM (G) and RM mitochondria (H). Note the similar velocity of normal-sized (<2.4 μm) and elongated mitochondria (>2.4 μm) during OE of dMiro (p < 0.05; N > 7; one-way ANOVA). Error bars represent SEM.

Similar articles

Cited by

References

    1. Aberle H, Haghighi AP, Fetter RD, McCabe BD, Magalhães TR, Goodman CS. wishful thinking encodes a BMP type II receptor that regulates synaptic growth in Drosophila. Neuron. 2002;33:545–558. - PubMed
    1. Abramoff MD, Magelhaes PJ, Ram SJ. Image processing with ImageJ. Biophot Internat. 2004;11:36–42.
    1. Brady ST, Pfister KK, Bloom GS. A monoclonal antibody against kinesin inhibits both anterograde and retrograde fast axonal transport in squid axoplasm. Proc Natl Acad Sci U S A. 1990;87:1061–1065. - PMC - PubMed
    1. Brand AH, Perrimon N. Targeted gene expression as a means of altering cell fates and generating dominant phenotypes. Development. 1993;118:401–415. - PubMed
    1. Chada SR, Hollenbeck PJ. Mitochondrial movement and positioning in axons: the role of growth factor signaling. J Exp Biol. 2003;206:1985–1992. - PubMed

Publication types

LinkOut - more resources