Comparative Study
. 2009 Apr 29;29(17):5483-93.
doi: 10.1523/JNEUROSCI.4153-08.2009.

Stimulus-specific adaptation in the inferior colliculus of the anesthetized rat

Affiliations
Comparative Study

Stimulus-specific adaptation in the inferior colliculus of the anesthetized rat

Manuel S Malmierca et al. J Neurosci. .

Abstract

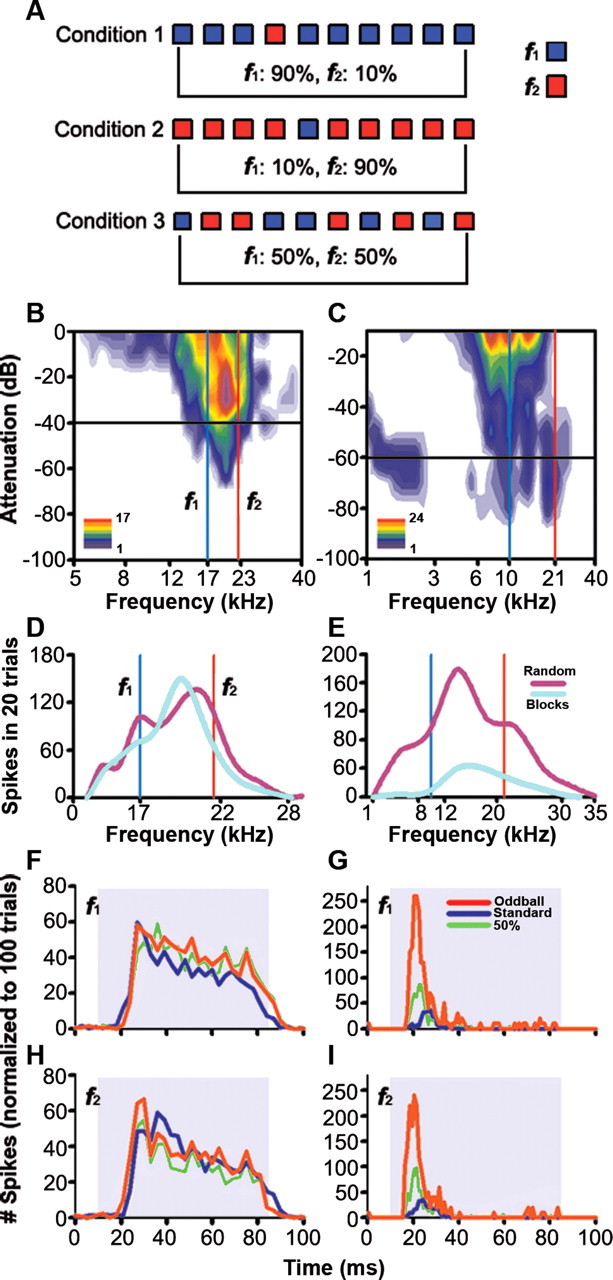
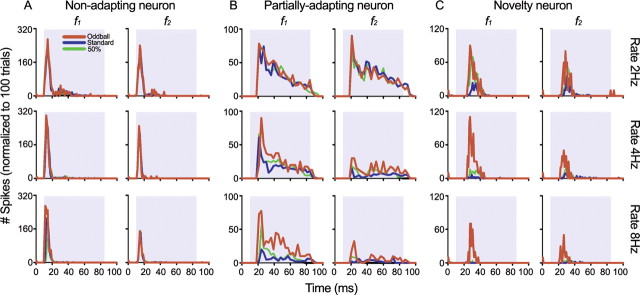
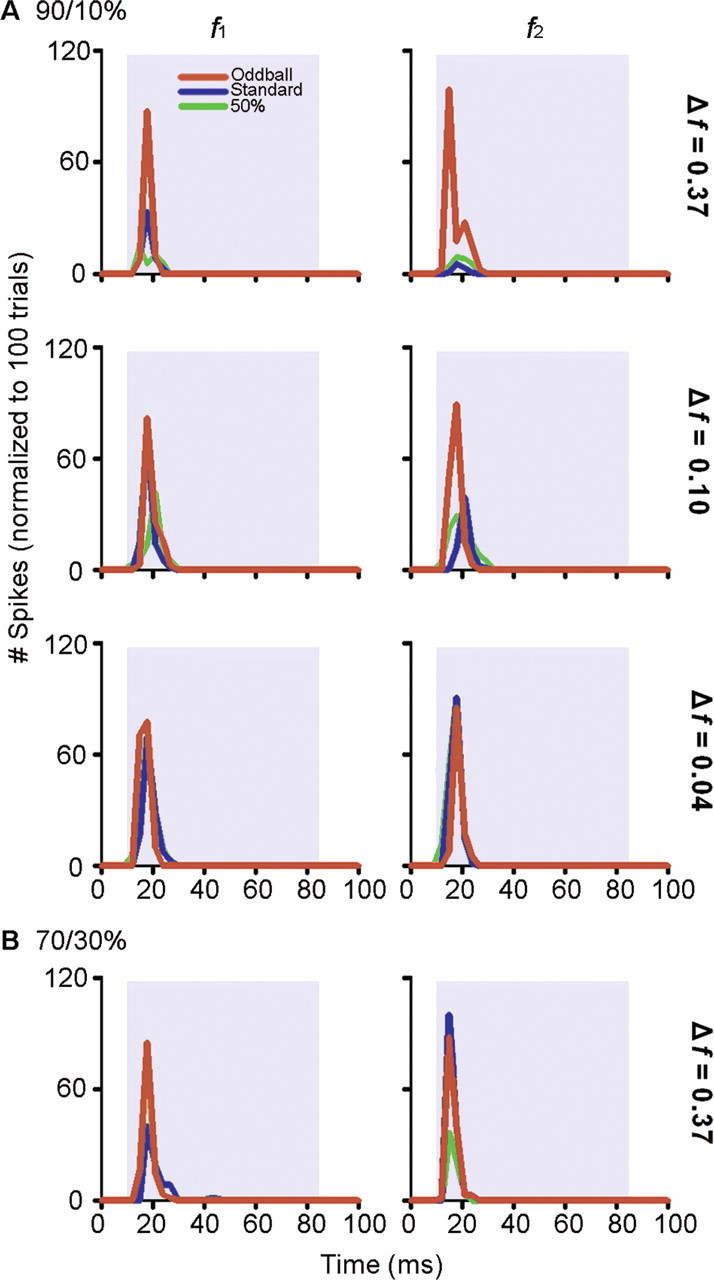
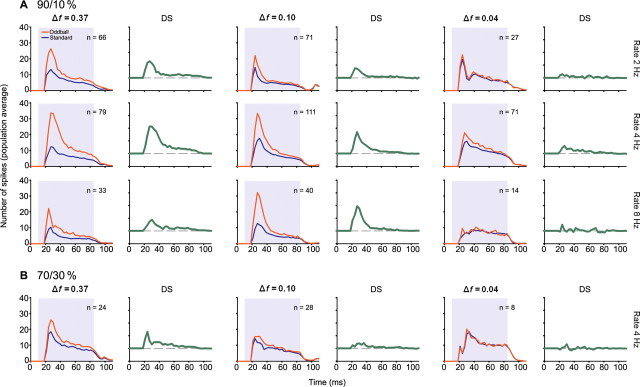
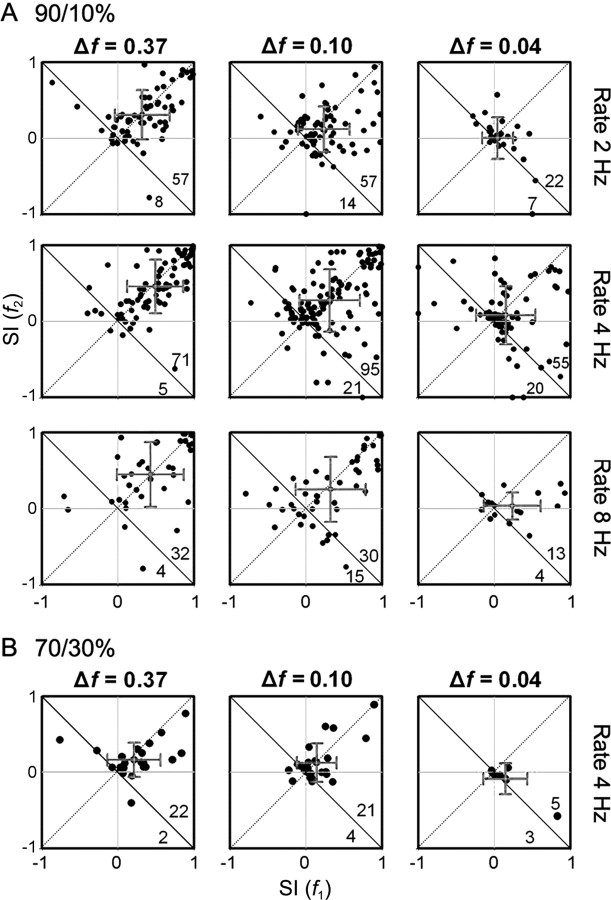
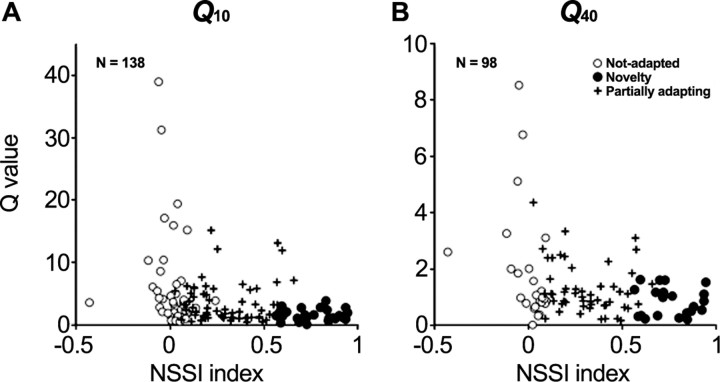
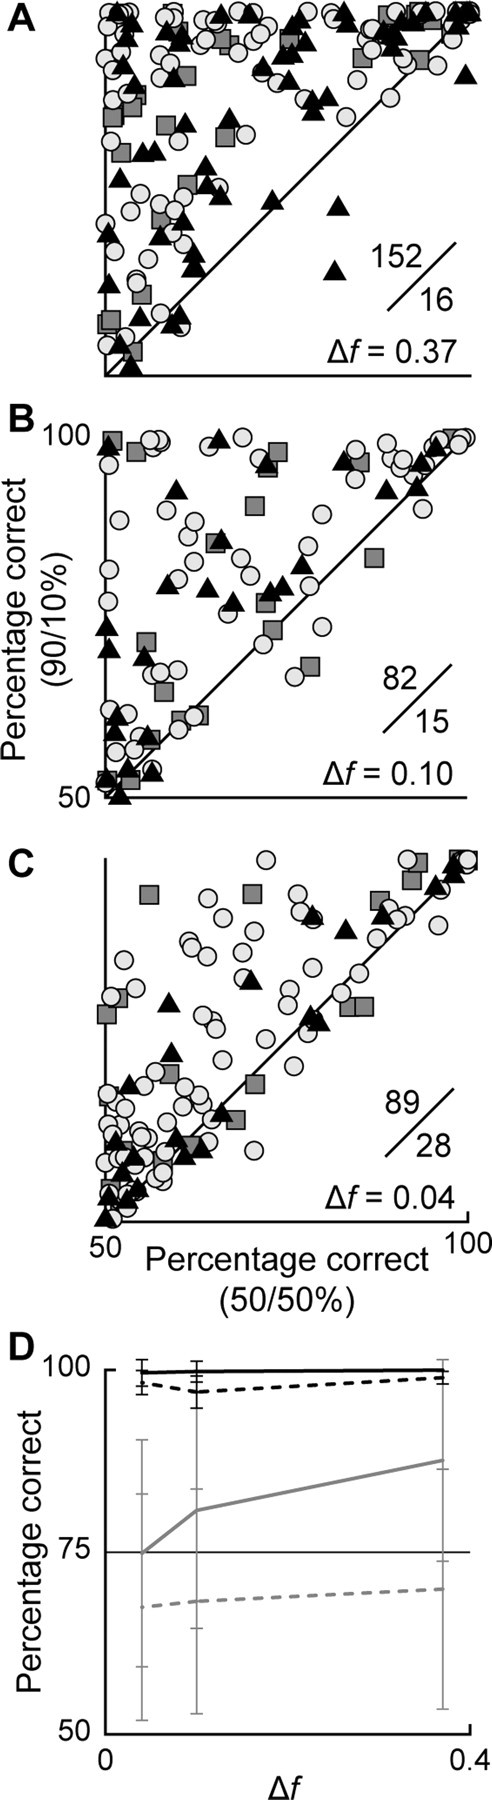
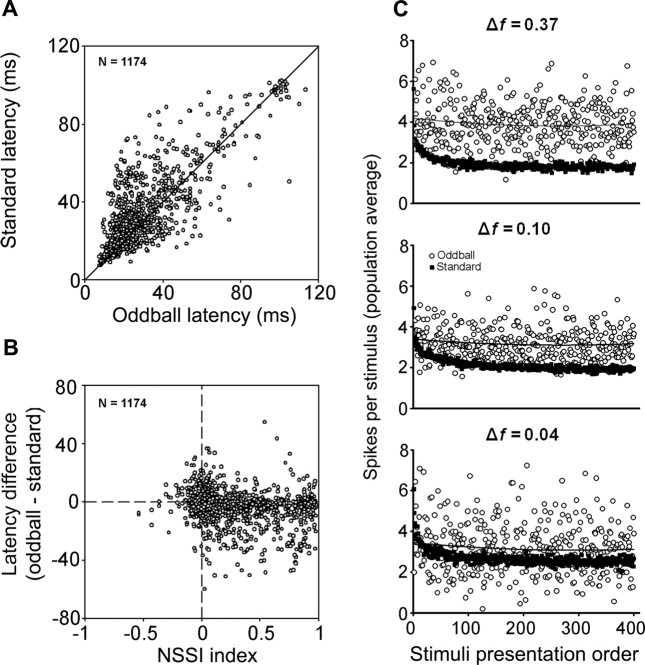
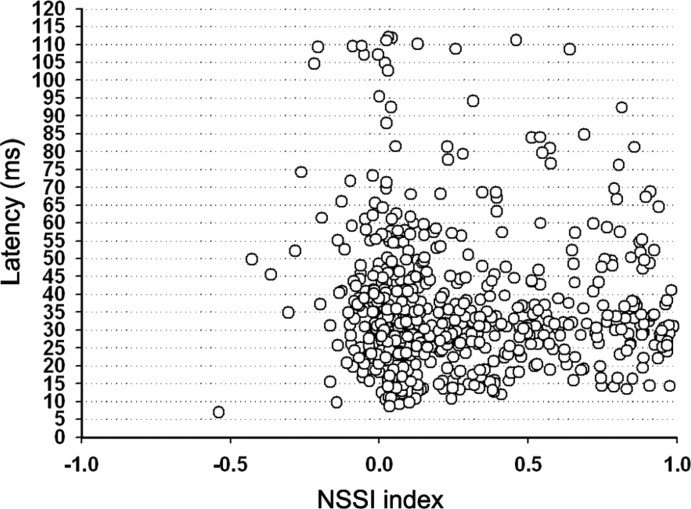
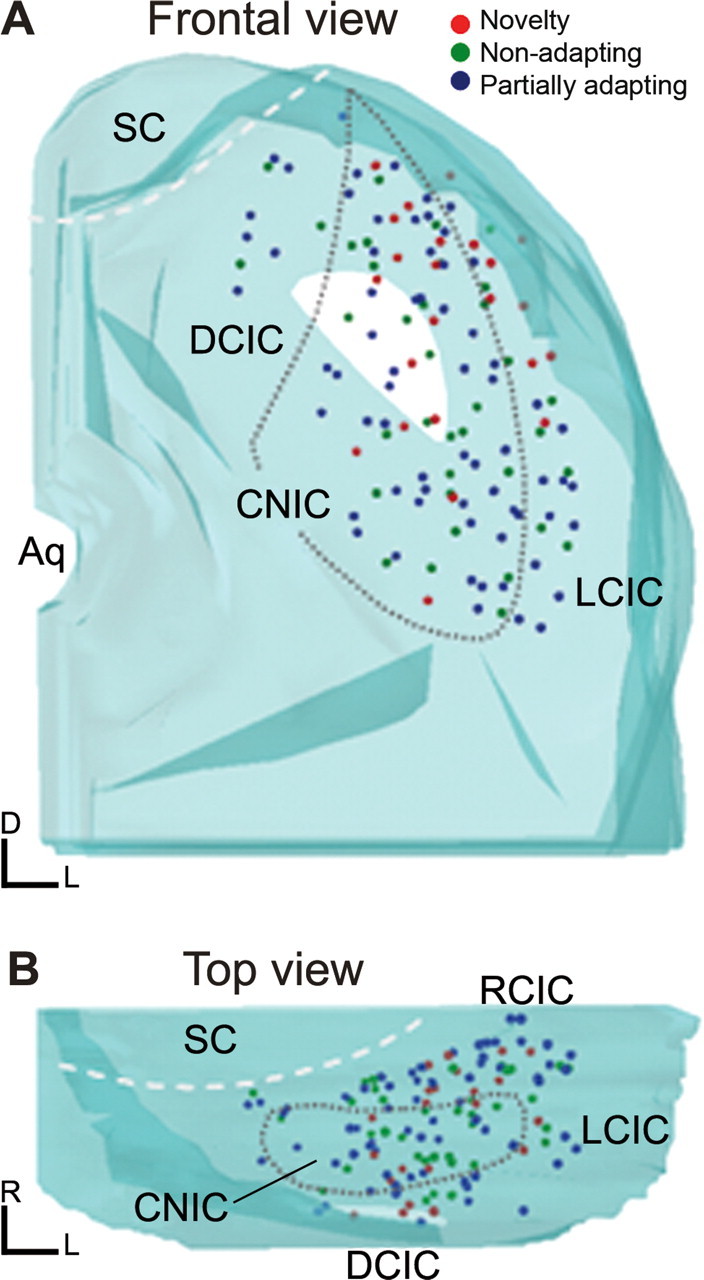
To identify sounds as novel, there must be some neural representation of commonly occurring sounds. Stimulus-specific adaptation (SSA) is a reduction in neural response to a repeated sound. Previous studies using an oddball stimulus paradigm have shown that SSA occurs at the cortex, but this study demonstrates that neurons in the inferior colliculus (IC) also show strong SSA using this paradigm. The majority (66%) of IC neurons showed some degree of SSA. Approximately 18% of neurons showed near-complete SSA. Neurons with SSA were found throughout the IC. Responses of IC neurons were reduced mainly during the onset component of the response, and latency was shorter in response to the oddball stimulus than to the standard. Neurons with near-complete SSA were broadly tuned to frequency, suggesting a high degree of convergence. Thus, some of the mechanisms that may underlie novelty detection and behavioral habituation to common sounds are already well developed at the midbrain.


Figures

Figure 1.
Figure 1.
Examples of the responses of two IC neurons to sounds presented in an oddball paradigm. A, Sequences of pure tones at two different frequencies (f1, f2) were presented, varying the probability of each of the frequencies. In Condition 1, f1 had 90% probability of occurring and f2 a 10% probability. In Condition 2 the probabilities of f1 and f2 were reversed. Finally, in Condition 3 both frequencies occurred with equal (50%) probability. In this and similar figures the high probability stimulus is referred to as standard, and the low probability one as the oddball. B, FRA of a neuron that showed little adaptation; C, FRA of a neuron that showed considerable SSA. The red and blue vertical lines on both FRAs show the two frequencies presented in the oddball paradigm and the black horizontal line shows the level. D and E show spike counts as a function of frequency for the same two neurons when frequencies were presented in random order (magenta line) or blocks of identical frequencies (light blue line). F and H show the normalized responses of the neuron on the left to tones presented using the oddball paradigm. The red trace is the response to the oddball stimulus (see A, f1 in Condition 2 and f2 in Condition 1); the blue trace is the response to the standard (f1 from Condition 1 and f2 from Condition 2), and the green line is the response when both tones were presented with equal probability (f1 and f2 from Condition 3). G and I show the responses of the neuron on the right, presented in the same format. In this and similar figures, the shaded background indicates the duration of the stimulus.
Figure 2.
Figure 2.
Effect of stimulus repetition rate on neurons with different amounts of adaptation, using the oddball paradigm. A, In a nonadapting neuron, the responses to the standard (blue traces) and oddball (red traces) stimuli are similar regardless of the repetition rate (2 Hz, top row; 4 Hz, middle row; 8 Hz, bottom row). B, Partially adapting neurons responded better to the oddball at the higher repetition rates. C, Novelty neurons responded much more strongly to the oddball than to the standard at all repetition rates tested. In all neurons that showed SSA, the response to the 50% probability condition was always smaller than that to oddball but larger than to the standard.
Figure 3.
Figure 3.
Effect of frequency contrast (Δf, see Results for details) and probability on a single neuron in the IC when stimuli were presented using the oddball paradigm. A, An increase in contrast between the two frequencies (f1, f2) resulted in an increase in the difference between the response to the standard and the response to the oddball. This difference was primarily caused by a reduced response to the standard as well as to an augmented response to the oddball. In this experiment, f1 was held constant at 4.3 kHz while f2 was systematically changed to obtain the required Δf, i.e., 6.3 kHz, 3.8 kHz, and 4.5 kHz for Δf = 0.37, 0.10, and 0.04, respectively. The top three rows (A) show data obtained when the probability of the oddball was 10%. B, When it was increased to 30%, the difference between the standard and the oddball was reduced (Δf = 0.37).
Figure 4.
Figure 4.
A, B, Average effect of stimulus probability (A, 90/10%; B, 70/30%), frequency contrast (columns) and stimulus repetition rate (rows) across the population of IC neurons The peristimulus histograms (PSTH) for the standard and oddball stimuli were normalized to 100 trials to account for the different probabilities and averaged across the entire sample of neurons recorded from the IC. The number of neurons for each condition is indicated on each panel. The corresponding DS (difference signal) shown to the right of each PSTH represents the difference between the population response to the oddball and standard stimuli. DS is larger for larger frequency contrasts, and lower oddball probabilities. It reaches a plateau at a stimulus repetition rate equal to or larger than 4 Hz.
Figure 5.
Figure 5.
A, B, Scatter plots of the frequency-specific SI at different probabilities (A, 90/10%; B, 70/30%), frequency contrasts (columns), and stimulation rates (rows). Because each neuron was tested using several combinations of parameters, individual neurons may be represented in more than one panel. The numbers on the bottom right indicate the number of dots on each side of the descending diagonal. The gray crosses indicate the mean and SD for each axis.
Figure 6.
Figure 6.
Relationship between individual FRAs and SSA. A and B show the distribution of Q10 dB and Q40 dB values relative to NSSI. The higher the SSA (NSSI values closer to 1), the more the range of Q values became restricted to small Q values.
Figure 7.
Figure 7.
A–C, Scatter plots based on ROC curve analysis comparing frequency discrimination by IC neurons in the 90/10% condition versus the 50/50% condition, for Δf = 0.37, 0.10, and 0.04. Each dot represents one neuron, and the symbols indicate the repetition rate: triangles, 2/s; circles, 4/s; squares, 8/s. The number of data points above and below the diagonal is shown in an inset; dots above the diagonal mean better discriminability for the 90/10% condition than for 50/50%. D, Variation of the average discriminability (mean ± SD) depending on Δf. Solid lines, 90/10%; dashed lines, 50/50%; gray lines, data including all neurons in the sample; black lines, data taken from only the 10% most sensitive neurons.
Figure 8.
Figure 8.
A, Comparison of mean first spike latency of responses to a given tone when it was presented as the standard stimulus and when it was presented as the oddball. Although there are data points on both sides of the 1:1 line, the majority of neurons have a standard latency that is longer than the oddball latency. B, When the difference between the standard and the oddball latencies is plotted as a function of the neuron-specific SSA index, it becomes apparent that in neurons with a high degree of SSA, the standard latency tends to be longer than the oddball latency. C, Time course of adaptation. The average number of spikes per stimulus in the sample is plotted against the order in which that stimulus occurred. Note how the response decays rapidly in the case of the standard stimuli resulting from adaptation, but not for the oddball stimuli. The higher variability in the responses to the oddball is probably caused by the smaller number of stimulus presentations, compared with the standard. Also note that the response to the oddball stimuli is stronger at a frequency contrast of 0.37, but it approaches the response to the standard as the frequency contrast is reduced.
Figure 9.
Figure 9.
Distribution of the average first-spike latency for both standard and oddball stimuli as a function of NSSI. Note that there is no correlation between NSSI and latency.
Figure 10.
Figure 10.
A, B, Computer-assisted three-dimensional reconstructions of the locations of neurons that were histologically localized, seen in a frontal projection (A) and in a horizontal projection (B), rotated 90° from the projection seen in A. Neurons showing the entire range of SSA were found in all subdivisions of the IC, although a higher proportion of the neurons with the highest degree of SSA were located in the dorsal and rostral parts of the IC. Aq, Aqueduct; DCIC, dorsal cortex of the inferior colliculus; LCIC, lateral cortex of the inferior colliculus; RCIC, rostral cortex of the inferior colliculus; SC, superior colliculus.

References

    1. Bajo VM, Antunes FM, Covey E, Malmierca MS. Is there stimulus-specific adaptation in the auditory thalamus? In: Lopez-Poveda EA, Palmer AR, Meddis R, editors. Advances in auditory physiology, psychophysics and models. New York: Springer; 2009. in press.
    1. Bajo VM, Moore DR. Descending projections from the auditory cortex to the inferior colliculus in the gerbil, Meriones unguiculatus. J Comp Neurol. 2005;486:101–116. - PubMed
    1. Bajo VM, Nodal FR, Bizley JK, Moore DR, King AJ. The ferret auditory cortex: descending projections to the inferior colliculus. Cereb Cortex. 2007;17:475–491. - PMC - PubMed
    1. Chechik G, Anderson MJ, Bar-Yosef O, Young ED, Tishby N, Nelken I. Reduction of information redundancy in the ascending auditory pathway. Neuron. 2006;51:359–368. - PubMed
    1. Condon CD, Weinberger NM. Habituation produces frequency-specific plasticity of receptive fields in the auditory cortex. Behav Neurosci. 1991;105:416–430. - PubMed

Publication types