Comparative Study
. 2009 Apr 29;29(17):5573-86.
doi: 10.1523/JNEUROSCI.4438-08.2009.

How multiple conductances determine electrophysiological properties in a multicompartment model

Affiliations
Comparative Study

How multiple conductances determine electrophysiological properties in a multicompartment model

Adam L Taylor et al. J Neurosci. .

Abstract

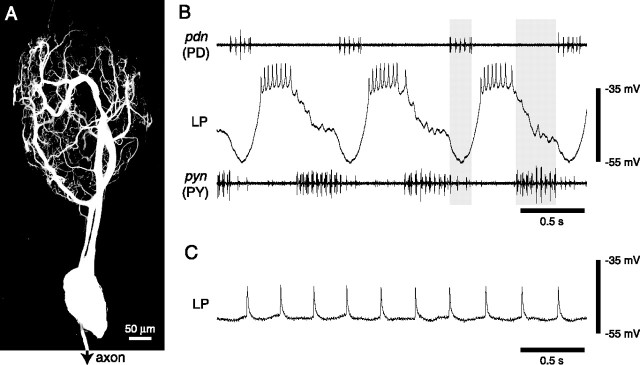
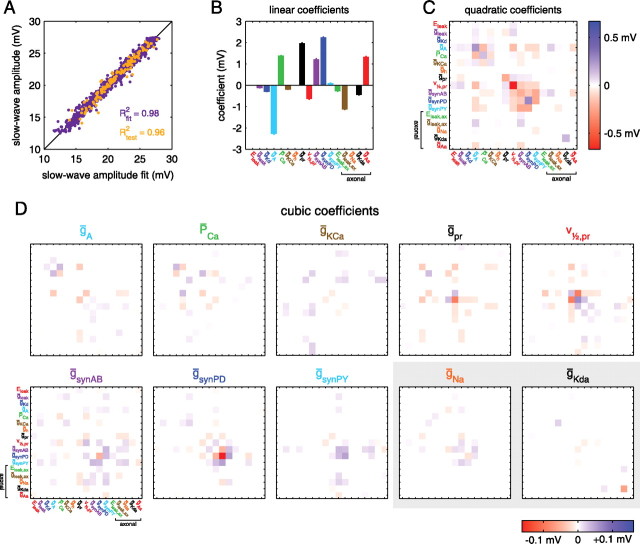
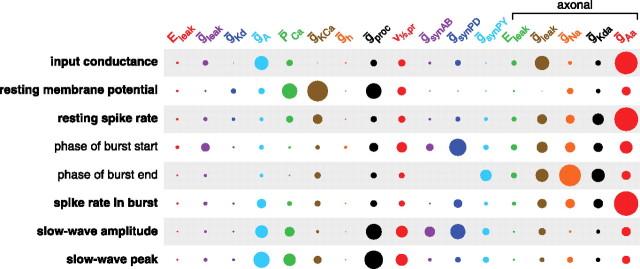
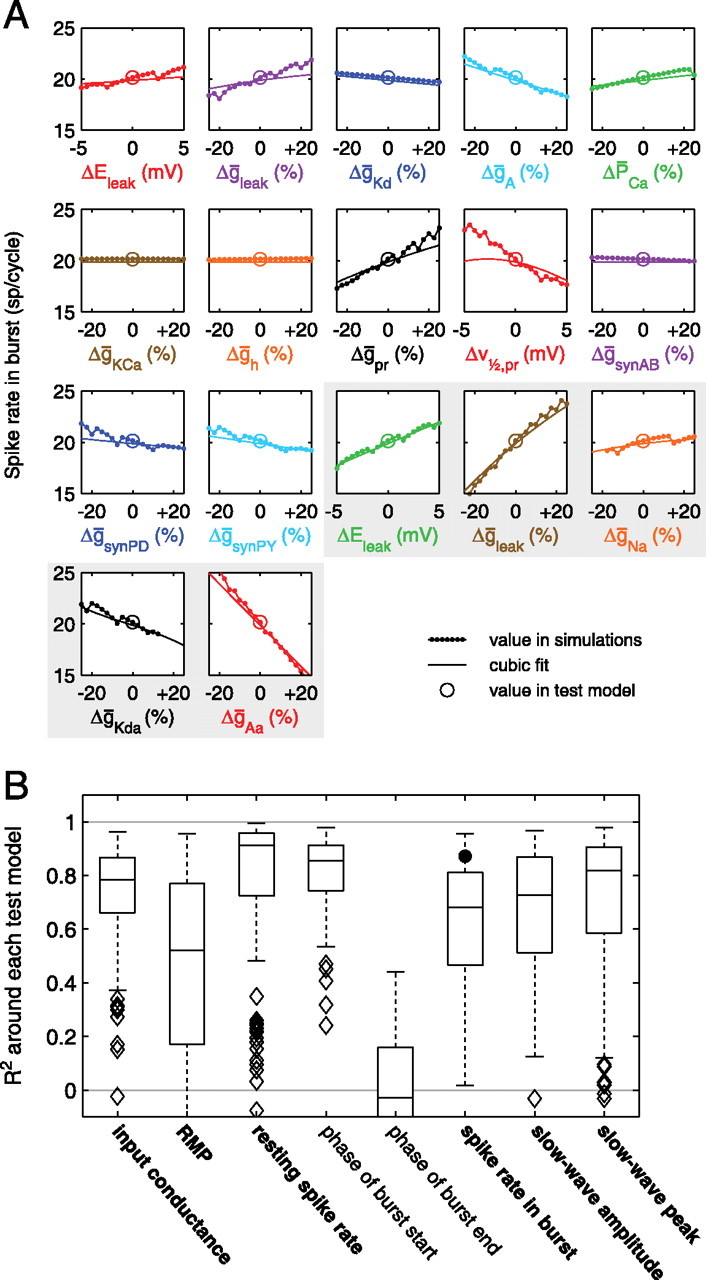
Most neurons have large numbers of voltage- and time-dependent currents that contribute to their electrical firing patterns. Because these currents are nonlinear, it can be difficult to determine the role each current plays in determining how a neuron fires. The lateral pyloric (LP) neuron of the stomatogastric ganglion of decapod crustaceans has been studied extensively biophysically. We constructed approximately 600,000 versions of a four-compartment model of the LP neuron and distributed 11 different currents into the compartments. From these, we selected approximately 1300 models that match well the electrophysiological properties of the biological neuron. Interestingly, correlations that were seen in the expression of channel mRNA in biological studies were not found across the approximately 1300 admissible LP neuron models, suggesting that the electrical phenotype does not require these correlations. We used cubic fits of the function from maximal conductances to a series of electrophysiological properties to ask which conductances predominantly influence input conductance, resting membrane potential, resting spike rate, phasing of activity in response to rhythmic inhibition, and several other properties. In all cases, multiple conductances contribute to the measured property, and the combinations of currents that strongly influence each property differ. These methods can be used to understand how multiple currents in any candidate neuron interact to determine the cell's electrophysiological behavior.


Figures

Figure 1.
Figure 1.
Circuit diagram of model. Each rectangle is an electrical compartment. Conductance abbreviations in each rectangle indicate which conductances were present in that compartment. All conductances were present at uniform density across the soma, near neurites, and far neurites compartments.
Figure 2.
Figure 2.
LP neuron morphology and activity. A, Two-photon laser-scanning confocal microscopy image of the LP neuron. B, Intracellular recording of the LP neuron during the ongoing pyloric rhythm. PD nerve (pdn) and pyloric nerve (pyn) recordings are included to show relative timing of the LP burst. Spikes on the pdn are from the two PD neurons, and the larger spikes on the pyn are from the PY neurons. C, Intracellular recording of the LP neuron when pyloric inputs have been blocked by applying 10−5 m picrotoxin.
Figure 3.
Figure 3.
Activity of six LP models, chosen at random. A, Spontaneous activity in six LP models, chosen at random. This is the model activity in the absence of synaptic inputs. Somatic potential is shown. B, Activity in response to pyloric-like inputs. Models are the same as in A, with corresponding colors. C, Model parameters for each model, scaled to the ranges used for sampling (see Table 2). Note that the models have very different patterns of maximal conductances and other parameters, despite having grossly similar activity. max, Maximum; min, minimum.
Figure 4.
Figure 4.
Comparison of pyloric activity in experiment and model. A, Histograms of onset phase of firing in experiment (exp) and models. B–E, Histograms of other properties of LP activity in the pyloric rhythm (exp) and in response to a pyloric-like pattern of synaptic inputs (model). Dashed lines in all panels show the constraints imposed on the model population to yield the LP models (as in Table 3). The y-axis in all panels is the percentage of data points.
Figure 5.
Figure 5.
Distributions of parameters and pairs of parameters in a population of 1304 model LP cells. A, Histograms of individual parameter values. Each x-axis spans the sampled range. Each y-axis is different. B, Scatterplots of pairs of parameter values. Each scatterplot contains 1304 points, corresponding to each of the LP models. Because each pair of parameters can be plotted either as x versus y or y versus x, the scatterplot matrix is symmetric about the diagonal. Scatterplots with blue/red background displayed a statistically significant positive/negative correlation between the two parameters. Histograms highlighted in yellow are those that arguably correspond to channels that Schulz et al. (2007) found to be positively correlated at the level of mRNA.
Figure 6.
Figure 6.
Coefficients of the polynomial fit to slow-wave amplitude. A, Quality of the fit. The slow-wave amplitude of each LP model is plotted versus the polynomial fit for that model. Purple points were used in fitting, and orange points were used for testing (see Materials and Methods). R2 for each class of points is given. A perfect fit would have all points along the identity line, shown in black. B, Linear coefficients of the polynomial fit. Coefficients have units of millivolts because parameters were z-scored before fitting (see Materials and Methods). Error bars indicate SE. C, Quadratic coefficients of the fit. D, Cubic coefficients of the fit. Panels with a shaded background correspond to axonal parameters. Parameters with uniformly small coefficients are omitted.
Figure 7.
Figure 7.
Quantification of the effect of each model parameter on each model property. The area of each circle represents the average amount of variance explained by that parameter, as a fraction of the variance explained by the complete fit, and where the average is taken over many different random orders in which the parameters are added to the fit (see Materials and Methods). The areas of the circles in each row sum to 1. Properties not in bold (phase of burst start/end) should be interpreted with caution, because the cubic fits were of poor quality (see Table 4).
Figure 8.
Figure 8.
Sensitivity analysis and cubic fits in the neighborhood of test models. A, Each panel shows the result of varying one parameter at a time. Note the close agreement between simulations and the cubic fit in most cases. Missing points in the Na and Kda panels indicate parameter values for which the models no longer spiked. The gray backdrop indicates axonal parameters. B, Summary of comparisons between sensitivity analysis and cubic fits. Box-and-whisker plots show the distribution of R2 values found when comparing the sensitivity data and cubic fits for each property. (The R2 values were calculated using only the changes relative to the respective central values; see Results.) Each box-and-whisker plot summarizes the distribution of R2 values for all 130 test models. The upper and lower limits of each box give the 75th and 25th percentiles of each distribution, and the line in the middle of each box gives the median. The dashed “whiskers” give the extent of all nonoutlier data points. A data point was classified as an outlier if it was more that 1.5 box heights away from the box. Outliers are shown as diamond symbols. Some properties had a few points with R2 values below the lower limit of the plot. The number of such points for the different properties was 5, 17, 0, 0, 58, 8, 2, and 7, respectively. The large black circle indicates the R2 value for the example shown in A. Properties not in bold had poor overall R2 values (see Table 4).

References

    1. Abbott LF. A network of oscillators. J Physics [A] 1990;23:3835–3859.
    1. Achard P, De Schutter E. Complex parameter landscape for a complex neuron model. PLoS Comput Biol. 2006;2:e94. - PMC - PubMed
    1. Baro DJ, Harris-Warrick RM. Differential expression and targeting of K+ channel genes in the lobster pyloric central pattern generator. Ann N Y Acad Sci. 1998;860:281–295. - PubMed
    1. Baro DJ, Ayali A, French L, Scholz NL, Labenia J, Lanning CC, Graubard K, Harris-Warrick RM. Molecular underpinnings of motor pattern generation: differential targeting of shal and shaker in the pyloric motor system. J Neurosci. 2000;20:6619–6630. - PMC - PubMed
    1. Brivanlou AH, Darnell JE., Jr Signal transduction and the control of gene expression. Science. 2002;295:813–818. - PubMed

Publication types

LinkOut - more resources