. 2009 Jul;58(7):1604-15.
doi: 10.2337/db09-0058. Epub 2009 Apr 29.

Beneficial endocrine but adverse exocrine effects of sitagliptin in the human islet amyloid polypeptide transgenic rat model of type 2 diabetes: interactions with metformin

Affiliations

Beneficial endocrine but adverse exocrine effects of sitagliptin in the human islet amyloid polypeptide transgenic rat model of type 2 diabetes: interactions with metformin

Aleksey V Matveyenko et al. Diabetes. 2009 Jul.

Abstract

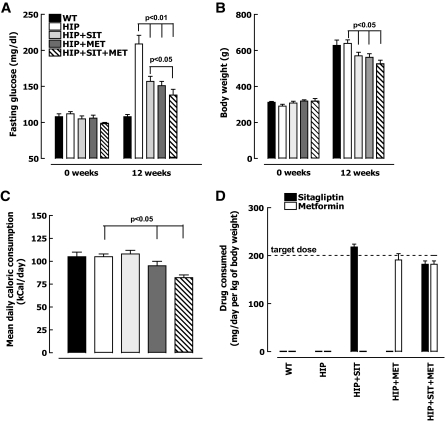
Objective: We sought to establish the extent and mechanisms by which sitagliptin and metformin singly and in combination modify islet disease progression in human islet amyloid polypeptide transgenic (HIP) rats, a model for type 2 diabetes.

Research design and methods: HIP rats were treated with sitagliptin, metformin, sitagliptin plus metformin, or no drug as controls for 12 weeks. Fasting blood glucose, insulin sensitivity, and beta-cell mass, function, and turnover were measured in each group.

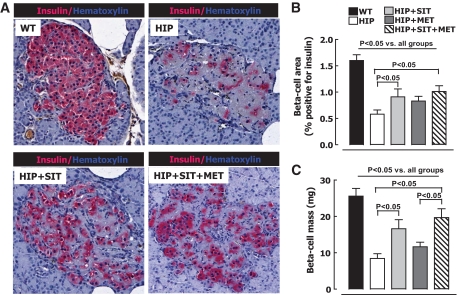
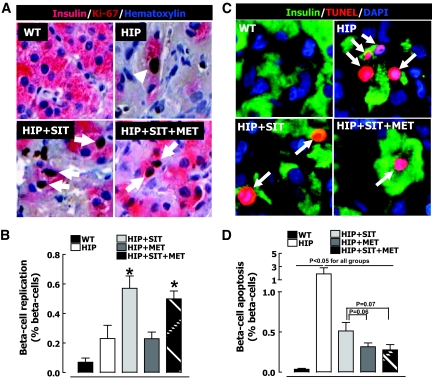
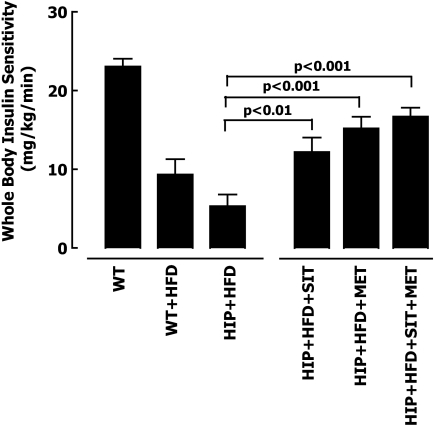
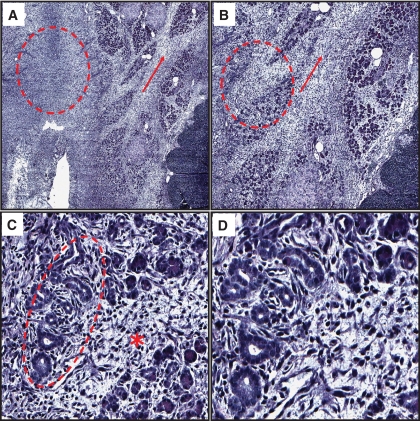
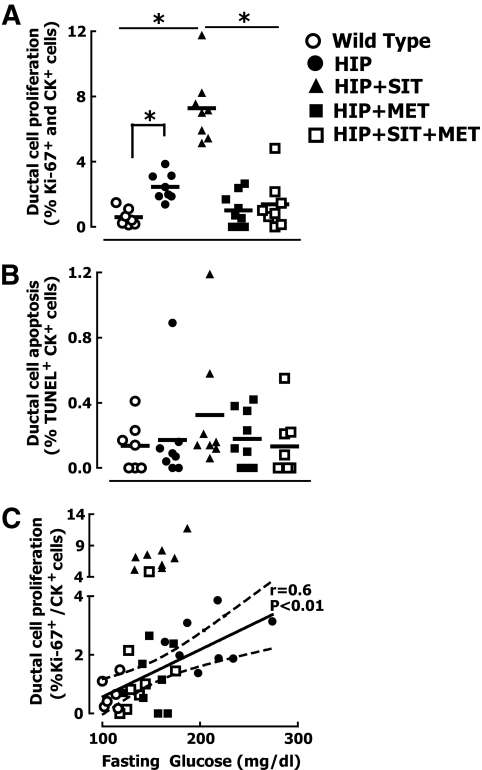
Results: Sitagliptin plus metformin had synergistic effects to preserve beta-cell mass in HIP rats. Metformin more than sitagliptin inhibited beta-cell apoptosis. Metformin enhanced hepatic insulin sensitivity; sitagliptin enhanced extrahepatic insulin sensitivity with a synergistic effect in combination. beta-Cell function was partially preserved by sitagliptin plus metformin. However, sitagliptin treatment was associated with increased pancreatic ductal turnover, ductal metaplasia, and, in one rat, pancreatitis.

Conclusions: The combination of metformin and sitagliptin had synergistic actions to preserve beta-cell mass and function and enhance insulin sensitivity in the HIP rat model of type 2 diabetes. However, adverse actions of sitagliptin treatment on exocrine pancreas raise concerns that require further evaluation.


Figures

FIG. 1.
FIG. 1.
Fasting plasma glucose (A), body weight (B), mean daily food intake (C), and mean daily drug consumption (D) after 12-week treatment with 60% high-fat chow diet in wild-type (WT) rats (n = 7), HIP rats (n = 8), HIP rats treated with sitagliptin (HIP+SIT; n = 8), HIP rats treated with metformin (HIP+MET; n = 9), and HIP rats treated with combination therapy (HIP+SIT+MET; n = 8). Data are means ± SE.
FIG. 2.
FIG. 2.
A: Typical islets from wild-type (WT) rats, HIP rats, HIP rats treated with sitagliptin (HIP+SIT), and HIP rats treated with sitagliptin and metformin (HIP+SIT+MET) stained for insulin (pink) and hematoxylin (blue). β-Cell area (B) and mean β-cell mass (C) after 12-week treatment with 60% high-fat diet in wild-type rats (n = 7), HIP rats (n = 8), HIP rats treated with sitagliptin (HIP+SIT; n = 8), HIP rats treated with metformin (HIP+MET; n = 9), and HIP rats treated with combination therapy (HIP+SIT+MET; n = 8). Data are the means ± SE. (A high-quality digital representation of this figure is available in the online issue.)
FIG. 3.
FIG. 3.
A: Examples of islets stained for insulin (pink) and replication marker Ki-67 (brown) and nuclear stain hematoxylin (blue) imaged at 20×. B: Frequency of β-cell replication in wild-type (WT) rats (n = 7), HIP rats (n = 8), HIP rats treated with sitagliptin (HIP+SIT; n = 8), HIP rats treated with metformin (HIP+MET; n = 9), and HIP rats treated with combination therapy (HIP+SIT+MET; n = 8). C: Examples of islets stained for insulin (green) and apoptosis marker (TUNEL; red) and nuclear stain (DAPI; blue) imaged at ×20. D: Frequency of β-cell apoptosis in wild-type rats (n = 7), HIP rats (n = 8), HIP rats treated with sitagliptin (n = 8), HIP rats treated with metformin (n = 9), and HIP rats treated with combination therapy (n = 8). Data are means ± SE. *P < 0.05 vs. wild type, HIP, and HIP plus metformin. Arrows indicate examples of insulin-positive Ki-67 and TUNEL-positive cells. (A high-quality digital representation of this figure is available in the online issue.)
FIG. 4.
FIG. 4.
Mean glucose infusion rates during the hyperinsulinemic-euglycemic clamp after 12-week treatment with 60% high-fat diet (HFD) in wild-type (WT) rats (n = 5), HIP rats (n = 6), HIP rats treated with sitagliptin (HIP+SIT; n = 7), HIP rats treated with metformin (HIP+MET; n = 6), and HIP rats treated with combination therapy (HIP+SIT+MET; n = 6). Data are means ± SE.
FIG. 5.
FIG. 5.
Mean first-phase insulin response during the hyperglycemic clamp (A), mean disposition index (B), mean first-phase insulin response to arginine (C), and the relationship between β-cell mass and first-phase insulin response to arginine (D) after 12-week treatment with 60% high-fat diet in wild-type (WT) rats (n = 6), HIP rats (n = 8), HIP rats treated with sitagliptin (HIP+SIT; n = 8), HIP rats treated with metformin (HIP+MET; n = 6), and HIP rats treated with combination therapy (HIP+SIT+MET; n = 6). Data are means ± SE.
FIG. 6.
FIG. 6.
Necrotizing pancreatitis in a HIP rat treated with sitagliptin for 12 weeks. A: Representative image at ×2 magnification of the exocrine pancreas stained for hematoxylin and eosin from an HIP rat treated with sitagliptin for 12 weeks with necrotizing pancreatitis. Note partially preserved lobular configuration of the exocrine pancreas; however, note the significant loss of acinar cell density and the widening of the septae (arrow) as well as a complete loss of acinar cells in some areas (circle). B: Representative image at ×4 magnification. At this higher magnification, septal fibrosis and inflammation (arrows) are better appreciated as well as partial and complete loss of acinar cells (circle). C: Representative image at ×20 magnification. At this magnification, acinar cell injury and angulated tubular ductal structures within the acini are clearly seen (circle). Note the extensive septal inflammation and fibrosis (*). D: Representative image at ×40 magnification. At this higher magnification, angulated tubular ductal structures and surrounding tissue fibrosis are better appreciated. (A high-quality digital representation of this figure is available in the online issue.)
FIG. 7.
FIG. 7.
Extensive ductal metaplasia in HIP rats treated with sitagliptin for 12 weeks. A and B: Representative images at ×10 magnification of ductal cell metaplasia observed in a rat treated with sitagliptin for 12 weeks. Metaplastic regions consisted of angulated tubular structures, interspersed fibrosis, and inflammatory cells and were located both adjacent to islets of Langerhans (*) as well as separated from islets (circle). C: Representative image at ×20 magnification. At this higher magnification, an apparent transition from intact acinar cells to damaged/atrophic acinar cells to angulated tubular ductal structures is seen. D: Representative image at ×40 magnification. At this magnification the presence of extensive angulated tubular ductal structures and surrounding tissue fibrosis within the metaplastic region is better appreciated. (A high-quality digital representation of this figure is available in the online issue.)
FIG. 8.
FIG. 8.
Extensive ductal metaplasia in sitagliptin-treated HIP rats is characterized by increased ductal cell turnover, tissue fibrosis, and absence of PDX-1 expression. A: Representative image at ×20 magnification of ductal cell metaplasia in an HIP rat treated with sitagliptin for 12 weeks stained for ductal cell marker (cytokeratin; green), replication marker (Ki-67; red), and nuclear stain (DAPI; blue). The extent of ductal cell replication within metaplasia is highlighted by coexpression of cytokeratin and Ki-67 immunoreactivity shown in the insert. B: The same area of ductal metaplasia was stained for ductal cell marker (cytokeratin; green), fibroblast marker (fibrinectin; red), and nuclear stain (DAPI; blue). C: The same area of ductal cell metaplasia stained for ductal marker (cytokeratin; green), PDX-1 (red), and insulin (blue). (A high-quality digital representation of this figure is available in the online issue.)
FIG. 9.
FIG. 9.
Ductal cell replication is increased in HIP rats treated with sitagliptin for 12 weeks. Representative images at ×20 magnification of exocrine ducts stained for cytokeratin (green), replication marker Ki-67 (red), and nuclear stain (DAPI; blue) in wild-type control rats, diabetic HIP rats, HIP rats treated with sitagliptin, or HIP rats treated with combination therapy. *Examples from sitagliptin-treated rats represent metaplasia and pancreatitis–free areas of the exocrine pancreas. Arrows indicate cytokeratin/Ki-67–positive cells. (A high-quality digital representation of this figure is available in the online issue.)
FIG. 10.
FIG. 10.
Increased ductal cell turnover in HIP rats treated with sitagliptin. Quantification of ductal cell replication (A) and apoptosis (B) in wild-type rats, HIP rats, and HIP rats treated with either sitagliptin (HIP+SIT), metformin (HIP+MET), or combination therapy of sitagliptin and metformin (HIP+SIT+MET) for 12 weeks. C: Regression analysis of the relationships between ductal cell proliferation versus fasting plasma glucose. Note that ductal cell replication in sitagliptin-treated rats was quantified only in metaplasia and pancreatitis–free areas of the exocrine pancreas. *P < 0.05.

Similar articles

Cited by

References

    1. King H, Aubert RE, Herman WH: Global burden of diabetes, 1995–2025: prevalence, numerical estimates, and projections. Diabetes Care 1998; 21: 1414– 1431 - PubMed
    1. Polonsky KS, Given BD, Van Cauter E: Twenty-four-hour profiles and pulsatile patterns of insulin secretion in normal and obese subjects. J Clin Invest 1988; 81: 442– 448 - PMC - PubMed
    1. Polonsky KS, Given BD, Hirsch LJ, Tillil H, Shapiro ET, Beebe C, Frank BH, Galloway JA, Van Cauter E: Abnormal patterns of insulin secretion in non-insulin-dependent diabetes mellitus. N Engl J Med 1988; 318: 1231– 1239 - PubMed
    1. Seltzer HS, Allen EW, Herron AL, Jr, Brennan MT: Insulin secretion in response to glycemic stimulus: relation of delayed initial release to carbohydrate intolerance in mild diabetes mellitus. J Clin Invest 1967; 46: 323– 335 - PMC - PubMed
    1. Weyer C, Bogardus C, Mott DM, Pratley RE: The natural history of insulin secretory dysfunction and insulin resistance in the pathogenesis of type 2 diabetes mellitus. J Clin Invest 1999; 104: 787– 794 - PMC - PubMed

Publication types

MeSH terms