

Simultaneous PET imaging of P-glycoprotein inhibition in multiple tissues in the pregnant nonhuman primate
- PMID: 19403878
- PMCID: PMC2703489
- DOI: 10.2967/jnumed.108.059360
Simultaneous PET imaging of P-glycoprotein inhibition in multiple tissues in the pregnant nonhuman primate
Abstract
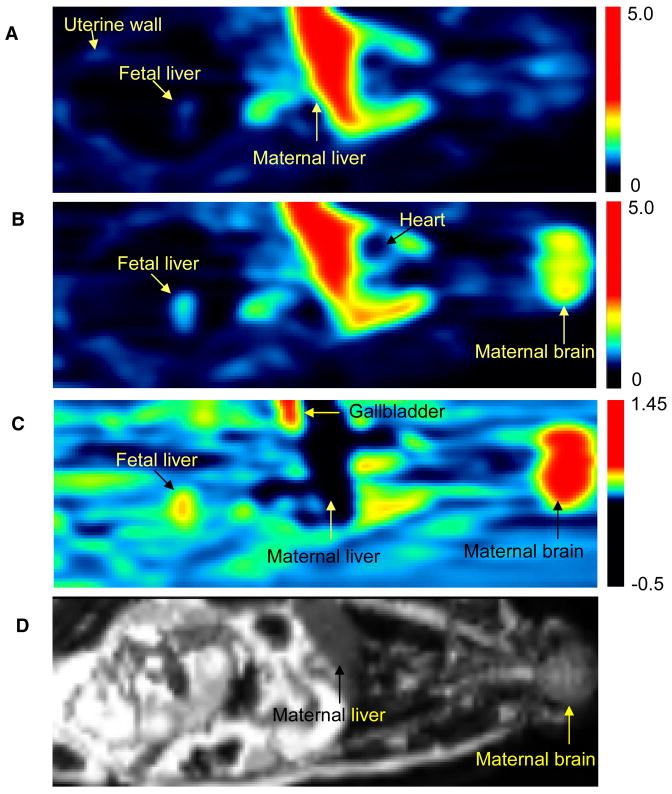
Studies in rodents indicate that the disruption of P-glycoprotein (P-gp) function increases drug distribution into the developing fetus and organs such as the brain. To simultaneously and serially evaluate the effect of P-gp activity and inhibition on the tissue distribution of drugs in a more representative animal model, we tested the feasibility of conducting whole-body PET of the pregnant nonhuman primate (Macaca nemestrina). We used (11)C-verapamil as the prototypic P-gp substrate and cyclosporine A (CsA) as the prototypic inhibitor.
Methods: Four pregnant macaques (gestational age, 145-159 d; gestational term, 172 d) were imaged after the intravenous administration of (11)C-verapamil (30-72 MBq/kg) before and during intravenous infusion of CsA (12 or 24 mg/kg/h, n = 2 each). The content of verapamil and its metabolites in plasma samples was determined using a rapid solid-phase extraction method. The plasma and tissue time-radioactivity concentration curves of (11)C were integrated over 0-9 min after each verapamil injection. The tissue or arterial plasma area under the time-concentration curve (AUC(tissue)/AUC(plasma)) served as a measure of the tissue distribution of (11)C radioactivity. CsA effect on (11)C radioactivity distribution was interpreted as P-gp inhibition. The change in the fetal liver AUC ratio served as a reporter of placental P-gp inhibition.
Results: CsA effect on tissue distribution of (11)C radioactivity (AUC ratios) did not increase with the mean blood concentration of CsA, indicating a near-maximal P-gp inhibition. CsA increased maternal brain and fetal liver distribution of (11)C radioactivity by 276% +/- 88% (P < 0.05) and 122% +/- 75% (P < 0.05), respectively. Changes in other measured tissues were not statistically significant.
Conclusion: These data demonstrate for the first time, to our knowledge, the feasibility of simultaneous, serial, noninvasive imaging of P-gp activity and inhibition in multiple maternal organs and the placenta in the nonhuman primate. Our findings, consistent with previous data in rodents, indicate that the activity of P-gp in the placenta and the blood-brain barrier is high and that the inhibition of P-gp facilitates drug distribution across these barriers.
Figures


Similar articles
-
Positron emission tomography imaging of tissue P-glycoprotein activity during pregnancy in the non-human primate.Br J Pharmacol. 2010 Jan 1;159(2):394-404. doi: 10.1111/j.1476-5381.2009.00538.x. Epub 2009 Dec 4. Br J Pharmacol. 2010. PMID: 20002098 Free PMC article.
-
Modeling cyclosporine A inhibition of the distribution of a P-glycoprotein PET ligand, 11C-verapamil, into the maternal brain and fetal liver of the pregnant nonhuman primate: impact of tissue blood flow and site of inhibition.J Nucl Med. 2013 Mar;54(3):437-46. doi: 10.2967/jnumed.112.111732. Epub 2013 Jan 28. J Nucl Med. 2013. PMID: 23359659 Free PMC article.
-
Imaging of cyclosporine inhibition of P-glycoprotein activity using 11C-verapamil in the brain: studies of healthy humans.J Nucl Med. 2009 Aug;50(8):1267-75. doi: 10.2967/jnumed.108.059162. Epub 2009 Jul 17. J Nucl Med. 2009. PMID: 19617341 Free PMC article.
-
Positron emission tomography studies on binding of central nervous system drugs and P-glycoprotein function in the rodent brain.Mol Imaging Biol. 2005 Jan-Feb;7(1):37-44. doi: 10.1007/s11307-005-0951-x. Mol Imaging Biol. 2005. PMID: 15912274 Review.
-
Using PET studies of P-gp function to elucidate mechanisms underlying the disposition of drugs.Curr Top Med Chem. 2010;10(17):1799-809. doi: 10.2174/156802610792927997. Curr Top Med Chem. 2010. PMID: 20645912 Review.
Cited by
-
ATP-binding cassette efflux transporters in human placenta.Curr Pharm Biotechnol. 2011 Apr;12(4):674-85. doi: 10.2174/138920111795164057. Curr Pharm Biotechnol. 2011. PMID: 21118087 Free PMC article. Review.
-
Preclinical PET imaging of the developing fetus during pregnancy: Current state and future potential.J Cereb Blood Flow Metab. 2025 Sep;45(9):1623-1634. doi: 10.1177/0271678X251340510. Epub 2025 May 14. J Cereb Blood Flow Metab. 2025. PMID: 40367390 Free PMC article. Review.
-
PET and SPECT radiotracers to assess function and expression of ABC transporters in vivo.Curr Drug Metab. 2011 Oct;12(8):774-92. doi: 10.2174/138920011798356980. Curr Drug Metab. 2011. PMID: 21434859 Free PMC article. Review.
-
Total-Body PET: Maximizing Sensitivity to Create New Opportunities for Clinical Research and Patient Care.J Nucl Med. 2018 Jan;59(1):3-12. doi: 10.2967/jnumed.116.184028. Epub 2017 Sep 21. J Nucl Med. 2018. PMID: 28935835 Free PMC article. Review.
-
Drug Concentration Asymmetry in Tissues and Plasma for Small Molecule-Related Therapeutic Modalities.Drug Metab Dispos. 2019 Oct;47(10):1122-1135. doi: 10.1124/dmd.119.086744. Epub 2019 Jul 2. Drug Metab Dispos. 2019. PMID: 31266753 Free PMC article. Review.
References
-
- Endres C, Hsiao P, Chung F, Unadkat J. The role of transporters in drug interactions. Eur J Pharm Sci. 2006;27:501–517. - PubMed
-
- Schinkel A. P-Glycoprotein, a gatekeeper in the blood-brain barrier. Adv Drug Deliv Rev. 1999;36:179–194. - PubMed
-
- Sasongko L, Link J, Muzi M, et al. Imaging P-glycoprotein transport activity at the human blood-brain barrier with positron emission tomography. Clin Pharmacol Ther. 2005;77:503–514. - PubMed
Publication types
MeSH terms
Substances
Grants and funding
LinkOut - more resources
Full Text Sources
Miscellaneous