Peripheral blood gene expression profiling in Sjögren's syndrome
- PMID: 19404300
- PMCID: PMC3273959
- DOI: 10.1038/gene.2009.20
Peripheral blood gene expression profiling in Sjögren's syndrome
Abstract
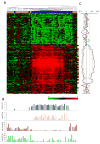
Sjögren's syndrome (SS) is a common chronic autoimmune disease characterized by lymphocytic infiltration of exocrine glands. The affected cases commonly present with oral and ocular dryness, which is thought to be the result of inflammatory cell-mediated gland dysfunction. To identify important molecular pathways involved in SS, we used high-density microarrays to define global gene expression profiles in the peripheral blood. We first analyzed 21 SS cases and 23 controls, and identified a prominent pattern of overexpressed genes that are inducible by interferons (IFNs). These results were confirmed by evaluation of a second independent data set of 17 SS cases and 22 controls. Additional inflammatory and immune-related pathways with altered expression patterns in SS cases included B- and T-cell receptor, insulin-like growth factor-1, granulocyte macrophage-colony stimulating factor, peroxisome proliferator-activated receptor-alpha/retinoid X receptor-alpha and PI3/AKT signaling. Exploration of these data for relationships to clinical features of disease showed that expression levels for most interferon-inducible genes were positively correlated with titers of anti-Ro/SSA (P<0.001) and anti-La/SSB (P<0.001) autoantibodies. Diagnostic and therapeutic approaches targeting interferon-signaling pathway may prove most effective in the subset of SS cases that produce anti-Ro/SSA and anti-La/SSB autoantibodies. Our results strongly support innate and adaptive immune processes in the pathogenesis of SS, and provide numerous candidate disease markers for further study.
Figures


References
-
- Lahita RG. Sjögren’s Syndrome: Textbook of the Autoimmune Diseases. Lippincott Williams & Wilkins; Philadelphia: 2000. pp. 569–572.
-
- Rhodus NL. An update on the management for the dental patient with Sjögren’s syndrome and xerostomia. Northwest Dent. 1999;78(4):27–34. - PubMed
-
- Masaki Y, Sugai S. Lymphoproliferative disorders in Sjogren’s syndrome. Autoimmun Rev. 2004;3(3):175–182. - PubMed
-
- Kassan SS, Thomas TL, Moutsopoulos HM, Hoover R, Kimberly RP, Budman DR, et al. Increased risk of lymphoma in sicca syndrome. Annals of internal medicine. 1978;89(6):888–892. - PubMed
-
- Fox PC, Speight PM. Current concepts of autoimmune exocrinopathy: immunologic mechanisms in the salivary pathology of Sjogren’s syndrome. Crit Rev Oral Biol Med. 1996;7(2):144–158. - PubMed
Publication types
MeSH terms
Substances
Grants and funding
LinkOut - more resources
Full Text Sources
Other Literature Sources
Medical
Research Materials

