. 2009;4(4):e5407.
doi: 10.1371/journal.pone.0005407. Epub 2009 Apr 30.

Local control of excitation-contraction coupling in human embryonic stem cell-derived cardiomyocytes

Affiliations

Local control of excitation-contraction coupling in human embryonic stem cell-derived cardiomyocytes

Wei-Zhong Zhu et al. PLoS One. 2009.

Abstract

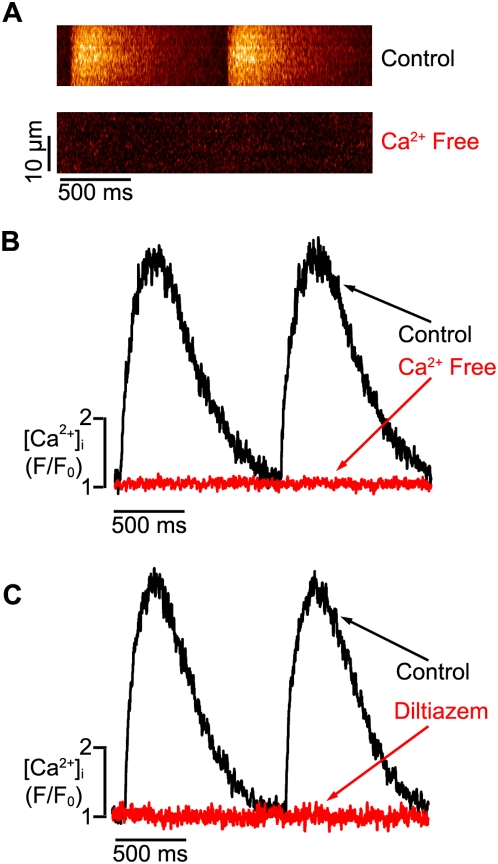
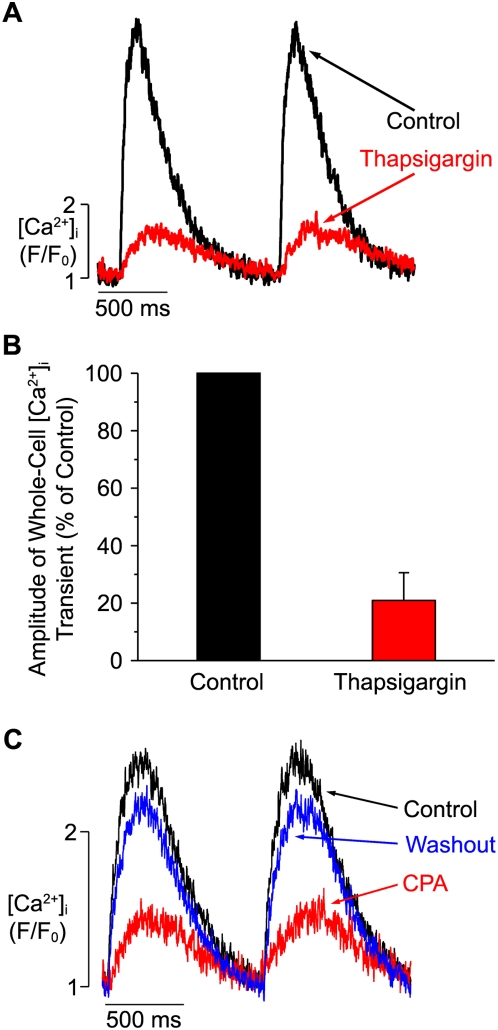
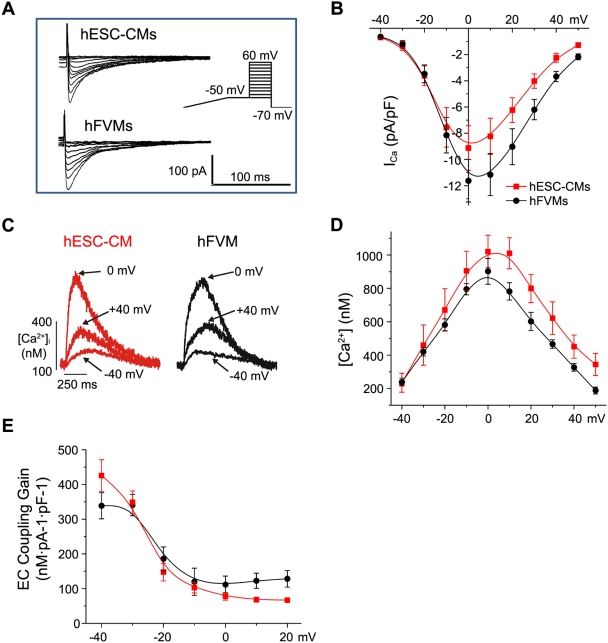
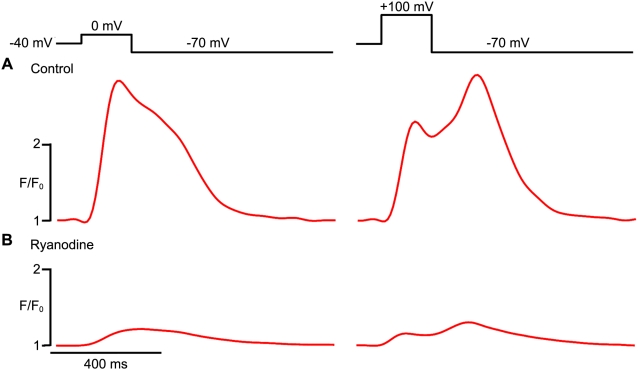
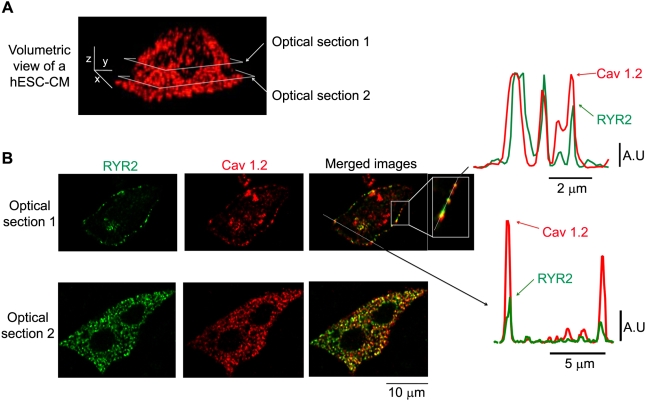
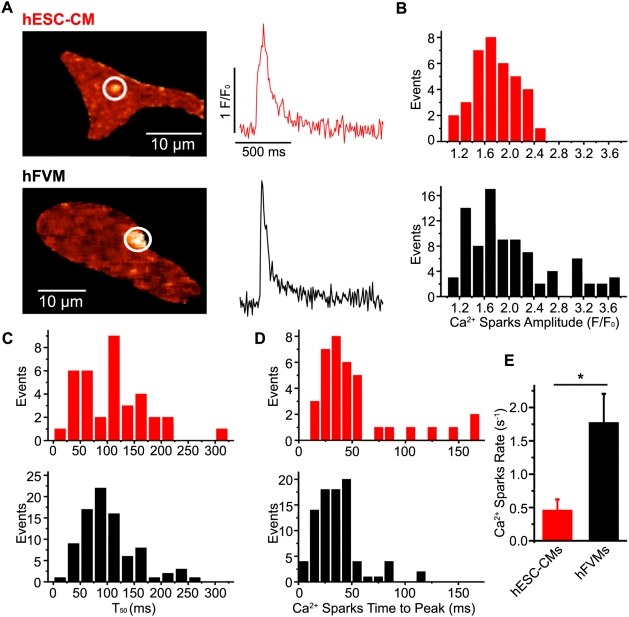
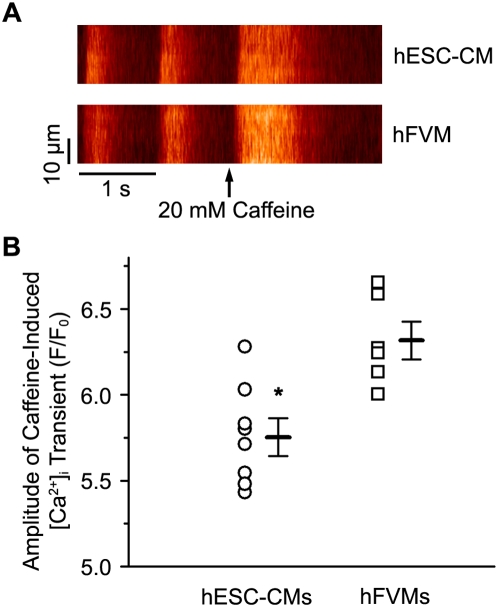
We investigated the mechanisms of excitation-contraction (EC) coupling in human embryonic stem cell-derived cardiomyocytes (hESC-CMs) and fetal ventricular myocytes (hFVMs) using patch-clamp electrophysiology and confocal microscopy. We tested the hypothesis that Ca(2+) influx via voltage-gated L-type Ca(2+) channels activates Ca(2+) release from the sarcoplasmic reticulum (SR) via a local control mechanism in hESC-CMs and hFVMs. Field-stimulated, whole-cell [Ca(2+)](i) transients in hESC-CMs required Ca(2+) entry through L-type Ca(2+) channels, as evidenced by the elimination of such transients by either removal of extracellular Ca(2+) or treatment with diltiazem, an L-type channel inhibitor. Ca(2+) release from the SR also contributes to the [Ca(2+)](i) transient in these cells, as evidenced by studies with drugs interfering with either SR Ca(2+) release (i.e. ryanodine and caffeine) or reuptake (i.e. thapsigargin and cyclopiazonic acid). As in adult ventricular myocytes, membrane depolarization evoked large L-type Ca(2+) currents (I(Ca)) and corresponding whole-cell [Ca(2+)](i) transients in hESC-CMs and hFVMs, and the amplitude of both I(Ca) and the [Ca(2+)](i) transients were finely graded by the magnitude of the depolarization. hESC-CMs exhibit a decreasing EC coupling gain with depolarization to more positive test potentials, "tail" [Ca(2+)](i) transients upon repolarization from extremely positive test potentials, and co-localized ryanodine and sarcolemmal L-type Ca(2+) channels, all findings that are consistent with the local control hypothesis. Finally, we recorded Ca(2+) sparks in hESC-CMs and hFVMs. Collectively, these data support a model in which tight, local control of SR Ca(2+) release by the I(Ca) during EC coupling develops early in human cardiomyocytes.


Conflict of interest statement

Competing Interests: Dr. Laflamme is a consultant to Geron Corporation (Menlo Park, CA), and his laboratory has a sponsored research agreement with Geron. Drs. Zhu and Santana have no competing interests to disclose.

Figures

Figure 1
Figure 1. External Ca2+ influx via L-type Ca2+ channels is required for EC coupling in hESC-CMs.
A. Confocal line-scan images from a representative, field-stimulated hESC-CM under control conditions (i.e. 1.8 mM external Ca2+, upper image) and after the application of a Ca2+-free solution (lower). B. Corresponding [Ca2+]i transients under control (black trace) and Ca2+-free (red) conditions. C. [Ca2+]i transients before (black) and after the application of the L-type Ca2+ channel blocker diltiazem (10 µM, red).
Figure 2
Figure 2. Thapsigargin decreases [Ca2+]i transients in hESC-CMs.
A. Time-course of field-stimulated [Ca2+]i transients in a representative hESC-CM under control conditions (black trace) and after exposure to thapsigargin (1 µM, red). B. Bar graph describing the percentage change in the peak of the [Ca2+]i transient before (control, black) and after (red) exposure to thapsigargin in hESC-CMs. C. Time-course of field-stimulated [Ca2+]i transients in a representative hESC-CM under control conditions (black), during exposure to 10 µM cyclopiazonic acid (CPA, red), and following washout of CPA (blue).
Figure 3
Figure 3. Voltage dependencies of I Ca and [Ca2+]i during EC coupling in hESC-CMs and hFVMs.
A. I Ca traces from typical hESC-CMs and hFVMs. I Ca was evoked elicited using the voltage protocol depicted in the inset to the right. In brief, cells were slowly depolarized from the holding potential of −70 mV to −50 mV, where they were held to inactivate the Na+ current. Cells were then depolarized from −50 mV to test potentials ranging from −40 to +60 mV for 200 ms. B. Current-voltage relationships of I Ca in hESC-CMs (red) and hFVMs (black). C. [Ca2+]i transients evoked by I Ca following depolarization to −40, 0, +40 mV in representative hESC-CMs and hFVMs. D. Voltage-dependence of the amplitude of the [Ca2+]i transient in hESC-CMs and hFVMs. E. Voltage-dependence of the EC coupling gain factor in hESC-CMs and hFVMs.
Figure 4
Figure 4. Tail [Ca2+]i transients in hESC-CMs.
A. [Ca2+]i traces from a representative hESC-CMs during a 200 ms step depolarization from −40 mV to a test potential of 0 mV (left) or +100 mV (right), followed by a repolarization to −70 mV. Note the large tail [Ca2+]i transient evoked by repolarization from +100 mV in the record to the right. B. Corresponding [Ca2+]i traces elicited by the same voltage protocols after treatment with ryanodine (10 µM).
Figure 5
Figure 5. Immunofluorescent co-localization of RyR2 and L-type Ca2+ channels in hESC-CMs.
A. Volumetric view of a stack of confocal anti-Cav1.2 images from a representative hESC-CM. Images were collected every 0.25 µm in the z-axis. The scale bars in the image indicate 5, 2, and 5 µm along the x, y, and z-axes, respectively. The horizontal grey boxes show the location of the two optical sections depicted in panel B. B. Two-dimensional anti-RyR2 (green, left), anti-L-type Ca2+ channels (anti-Cav1.2, red, center), and merged images, corresponding to optical sections 1 and 2 from panel A. Note that the merged image from optical section 1 includes two dotted lines, one that runs along the cell membrane (magnified in the inset) and one that traverses the cell. The corresponding plots to the right indicate the two-channel fluorescent intensity along each of the aforementioned lines.
Figure 6
Figure 6. Ca2+ sparks in hESC-CMs and hFVMs.
A. Confocal images of Ca2+ sparks in typical hESC-CMs and hFVMs. The traces to the right of each image show the time-course of [Ca2+]i in each Ca2+ spark site (red trace: hESC-CM, black trace: hFVM). Histograms of the amplitude (B), decay time to 50% amplitude (T50) (C), and time-to-peak (D) for Ca2+ sparks in hESC-CMs (red bars, upper) and hFVMs (black bars, lower). E. Bar graph indicating the rate of Ca2+ spark occurrence in hESC-CMs and hFVMs. * p<0.05.
Figure 7
Figure 7. Higher SR Ca2+ load in hFVMs than in hESC-CMs.
A. Line-scan images showing AP-evoked and caffeine-induced [Ca2+]i transients in hESC-CMs (upper image) and hFVMs (lower image). Delivery of the 20 mM caffeine is indicated by the arrows. B. Scatter plot of the amplitude of the caffeine-induced [Ca2+]i transient in hFVMs and hESC-CMs. The horizontal bars in the plot show the mean±SEM of the caffeine-induced [Ca2+]i transient in each experimental group. * p<0.05.

Similar articles

Cited by

References

    1. Reinecke H, Minami E, Zhu WZ, Laflamme MA. Cardiogenic differentiation and transdifferentiation of progenitor cells. Circ Res. 2008;103:1058–1071. - PMC - PubMed
    1. Zhu WZ, Hauch KD, Xu C, Laflamme MA. Human embryonic stem cells and cardiac repair. Transplant Rev (Orlando) 2009;23:53–68. - PMC - PubMed
    1. Bers DM. Excitation-contraction coupling and cardiac contractile force. Dordrecht, The Netherlands: 2001.
    1. Cheng H, Lederer WJ. Calcium sparks. Physiol Rev. 2008;88:1491–1545. - PubMed
    1. Cannell MB, Cheng H, Lederer WJ. The control of calcium release in heart muscle. Science. 1995;268:1045–1049. - PubMed

Publication types