. 2009 Mar 9:3:4.
doi: 10.3389/neuro.07.004.2009. eCollection 2009.

What is the Most Sensitive Measure of Water Maze Probe Test Performance?

Affiliations

What is the Most Sensitive Measure of Water Maze Probe Test Performance?

Hamid R Maei et al. Front Integr Neurosci. .

Abstract

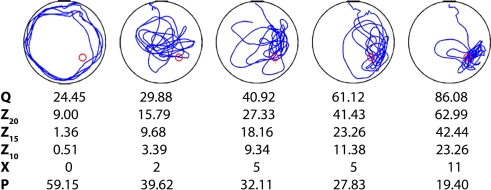
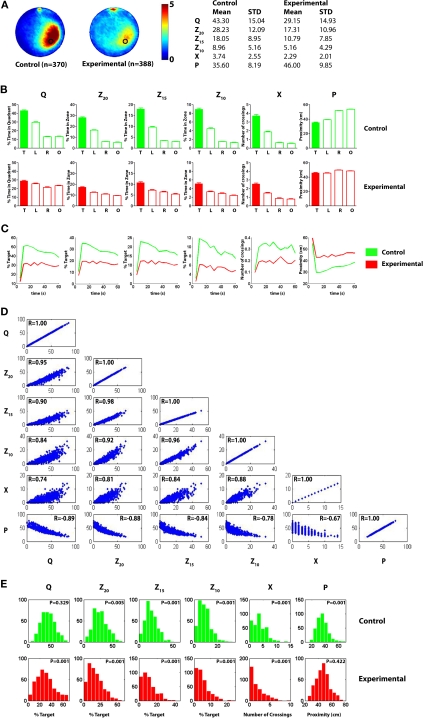
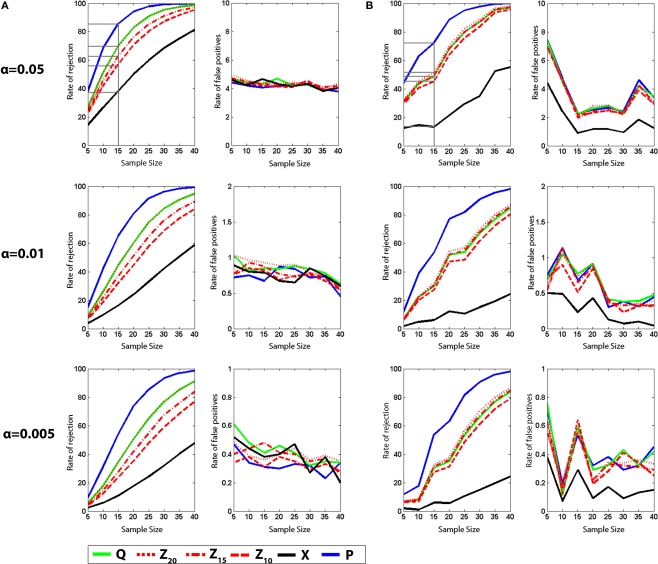
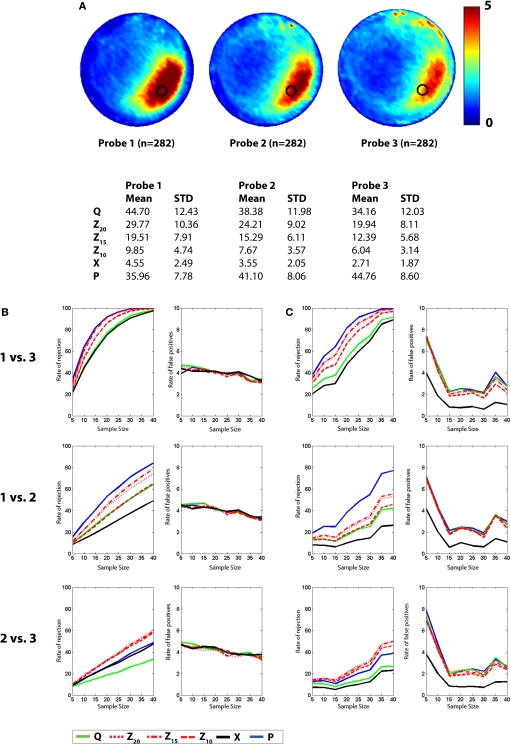
The water maze is commonly used to assay spatial cognition, or, more generally, learning and memory in experimental rodent models. In the water maze, mice or rats are trained to navigate to a platform located below the water's surface. Spatial learning is then typically assessed in a probe test, where the platform is removed from the pool and the mouse or rat is allowed to search for it. Performance in the probe test may then be evaluated using either occupancy-based (percent time in a virtual quadrant [Q] or zone [Z] centered on former platform location), error-based (mean proximity to former platform location [P]) or counting-based (platform crossings [X]) measures. While these measures differ in their popularity, whether they differ in their ability to detect group differences is not known. To address this question we compiled five separate databases, containing more than 1600 mouse probe tests. Random selection of individual trials from respective databases then allowed us to simulate experiments with varying sample and effect sizes. Using this Monte Carlo-based method, we found that the P measure consistently outperformed the Q, Z and X measures in its ability to detect group differences. This was the case regardless of sample or effect size, and using both parametric and non-parametric statistical analyses. The relative superiority of P over other commonly used measures suggests that it is the most appropriate measure to employ in both low- and high-throughput water maze screens.

Keywords: Monte Carlo simulation; hippocampus; non-parametric; parametric; water maze.


Figures

Figure 1
Figure 1
Examples of five individual probe tests. Mice were trained in the water maze with six trials per day for 5 days. Shown are representative swim paths in a probe test conducted following the completion of training. Corresponding quantification of probe test performance is shown below for the four widely used probe test measures: quadrant (Q), zone (Z20, Z15, Z10), crossings (X) and proximity (P).
Figure 2
Figure 2
Popularity of different probe test measures. To assess the relative frequency with which different probe test measures are used, a PubMed search (http://www.ncbi.nlm.nih.gov/sites/entrez) using the terms [(rat OR mouse) AND water maze] was conducted for the period 2004–2006. Out of a total of 205 papers surveyed, 135 assessed spatial learning/memory using a probe test. The pie chart shows the relative frequency that different measures (or combinations of measures) were used to quantify probe test performance in these studies.
Figure 3
Figure 3
Pooled probe test data for control and experimental mice for analysis A. (A) Left, density plots for grouped data showing where control and experimental mice concentrated their searches in the probe test. The color scale represents the mean number of visits per animal per 5 cm × 5 cm area. Right, summary of descriptive statistics (mean values, standard deviations) for the target quadrant (Q), zone (Z20, Z15 and Z10), crossing (X) and proximity (P) measures for control and experimental datasets. (B) Comparison of target (T) vs. other pseudo-platform locations (right, R; left, L; opposite, O) for each measure (upper graphs show control data, lower graphs experimental data). (C) Temporal profile of spatial bias across 60 s probe test for quadrant (Q), zone (Z20, Z15 and Z10), crossing (X) and proximity (P) measures. Averaged data are shown in 5 s bins for control (green) and experimental (red) datasets. (D) Scatterplots illustrating how respective water maze measures correlate with one another for all 758 probe tests included in the control and experimental datasets. Measures tended to be highly correlated, with r-values range from 0.67 to 0.98 (all P-values <0.01). (E) Distribution of probe test scores for control (upper; green) and experimental (lower; red) datasets for each measure. According to the Lilliefors (Kolmogorov–Smirnov) test, many distributions are positively skewed (P-values <0.05).
Figure 4
Figure 4
Monte Carlo simulations (analysis A). (A) t-tests. Left, the likelihood of detecting a difference between control and experimental groups is shown for varying sample (N) size, with significance levels α = 0.05, 0.01 and 0.005. Right, false-positive rates when both samples are drawn from the control dataset. (B) K–S tests. Left, the likelihood of detecting a difference between control and experimental groups is shown for varying sample (N) size, with significance levels α = 0.05, 0.01 and 0.005. Right, false-positive rate when both samples are drawn from the control dataset. Q (green), Z (red; Z20, Z15 and Z10), X (black) and P (blue).
Figure 5
Figure 5
Monte Carlo simulations (analysis B). Mice were trained in the water maze for 5 days (six trials per day) and then given a series of three probe tests. (A) Density plots for grouped data showing probes 1, 2 and 3. The color scale represents the number of visits per animal per 5 cm × 5 cm area. The table below indicates that performance declined across probe tests, according to all measures. (B) t-tests. Left, the likelihood of detecting a difference between the probe 1, 2 and 3 datasets is shown for varying sample (N) size, with significance levels α = 0.05. Right, false-positive rates when both samples are drawn from the same dataset. (C) K–S tests. Left, the likelihood of detecting a difference between the probe 1, 2 and 3 datasets is shown for varying sample (N) size, with significance levels α = 0.05. Right, false-positive rates when both samples are drawn from the same dataset. Q (green), Z (red; Z20, Z15 and Z10), X (black) and P (blue).

References

    1. Chapman P. F., White G. L., Jones M. W., Cooper-Blacketer D., Marshall V. J., Irizarry M., Younkin L., Good M. A., Bliss T. V., Hyman B. T., Younkin S. G., Hsiao K. K. (1999). Impaired synaptic plasticity and learning in aged amyloid precursor protein transgenic mice. Nat. Neurosci. 2, 271–27610.1038/6374 - DOI - PubMed
    1. Chen G., Chen K. S., Knox J., Inglis J., Bernard A., Martin S. J., Justice A., McConlogue L., Games D., Freedman S. B., Morris R. G. (2000). A learning deficit related to age and beta-amyloid plaques in a mouse model of Alzheimer's disease. Nature 408, 975–97910.1038/35046031 - DOI - PubMed
    1. Clapcote S. J., Roder J. C. (2004). Survey of embryonic stem cell line source strains in the water maze reveals superior reversal learning of 129S6/SvEvTac mice. Behav. Brain Res. 152, 35–48 - PubMed
    1. de Hoz L., Martin S. J., Morris R. G. (2004). Forgetting, reminding, and remembering: the retrieval of lost spatial memory. PLoS Biol. 2, E225.10.1371/journal.pbio.0020225 - DOI - PMC - PubMed
    1. Dvorkin A., Benjamini Y., Golani I. (2008). Mouse cognition-related behavior in the open-field: emergence of places of attraction. PLoS Comput. Biol. 4, e1000027.10.1371/journal.pcbi.1000027 - DOI - PMC - PubMed

LinkOut - more resources