. 2007 Jul;1(2):137-46.
doi: 10.2976/1.2760023. Epub 2007 Jul 27.

Characterization of the nucleation barriers for protein aggregation and amyloid formation

Affiliations

Characterization of the nucleation barriers for protein aggregation and amyloid formation

Stefan Auer et al. HFSP J. 2007 Jul.

Abstract

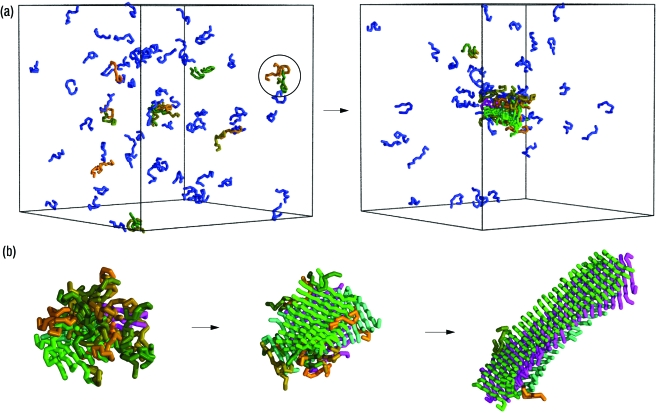
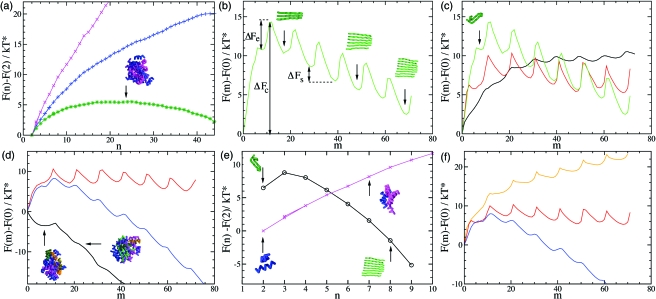
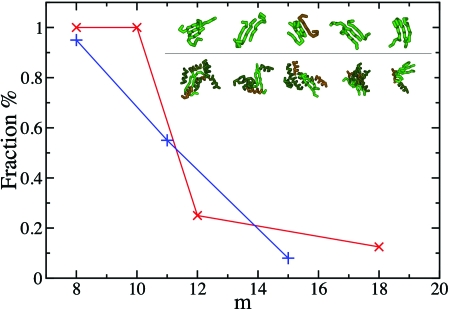
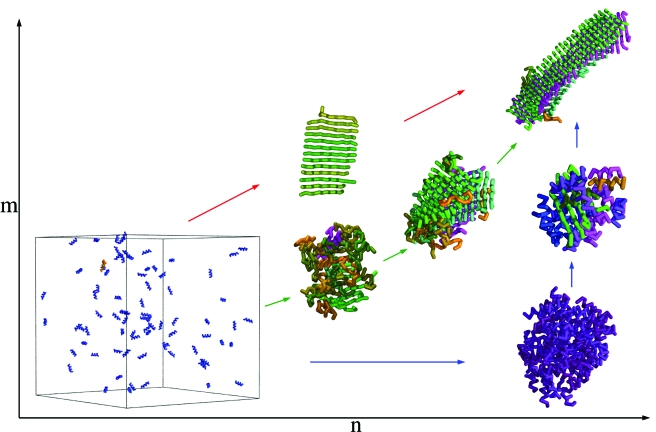
Despite the complexity and the specificity of the amino acid code, a variety of peptides and proteins unrelated in sequence and function exhibit a common behavior and assemble into highly organized amyloid fibrils. The formation of such aggregates is often described by a nucleation and growth mechanism, in which the proteins involved also form intermediate oligomeric aggregates before they reorganize and grow into ordered fibrils with a characteristic cross-beta structure. It is extremely difficult to experimentally obtain an accurate description of the early stages of this phenomenon due to the transient nature and structural heterogeneity of the oligomeric precursors. We investigate here the phenomenon of ordered aggregation by using the recently introduced tube model of polypeptide chains in conjunction with the generic hypothesis of amyloid formation. Under conditions where oligomer formation is a rare event-the most common conditions for forming amyloid fibrils by experiment-we calculate directly the nucleation barriers associated with oligomer formation and conversion into cross-beta structure in order to reveal the nature of these species, determine the critical nuclei, and characterize their dependence on the hydrophobicity of the peptides and the thermodynamic parameters associated with aggregation and amyloid formation.


Figures

Figure 1
Figure 1. Illustration of the condensation-ordering mechanism of amyloid formation.
The calculations are carried out at concentration c=12.5 mM and temperature T*=0.66 using the method described in the text. The ratio of the energies to form one hydrogen bond and one hydrophobic contact is eHBeHP=20. (a) Initially, at t⩽3,000, the peptides are in a solvated state (left). As the simulation progresses, at t=6,000, a small disordered oligomer appears (right). Here the progress variable t is the number of Monte Carlo moves performed in the simulation, and one unit of t is a block of 105 Monte Carlo moves. The color code is such that peptides that do not form interchain hydrogen bonds are shown in blue, those with interchain hydrogen bonds are assigned a random color, as for example the peptides indicated by the circle in the left figure. Peptides within the same β-sheet are assigned the same color. (b) Conversion of a disordered oligomer into an amyloidlike structure during the simulation: t=6,000 (left), t=9,000 (middle), t=15,000 (right).
Figure 2
Figure 2. Direct calculation of the free energy barriers associated with amyloid formation.
(a) Free energy barriers for the formation of an oligomer as a function of n (the number of peptides). The calculations are carried out at a temperature T*=0.51 and at concentrations c=1.2 mM (magenta), c=4.9 mM (blue), c=6.7 mM (green). The ratio of the energies to form one hydrogen bond and one hydrophobic contact is eHBeHP=20. (b) Free energy barrier for the formation of a β-sheet as a function of m (the number of interchain hydrogen bonds) calculated at c=4.9 mM, T*=0.45, and eHBeHP=50. The configurations shown in the figure illustrate the relationship between the free energy barrier and the size of the β-strands. (c) Temperature dependence of the free energy barrier shown panel (b); results are shown for T*=0.6 (black), T*=0.51 (red), and T*=0.45 (green). (d) Free energy barriers at three different polypeptide concentrations c=1.2 mM (red), c=4.9 mM (blue), c>6.7 mM (black) at T*=0.51, and eHBeHP=20 (e) Comparison of the free energy barriers obtained for the formations of oligomers (magenta) and β-sheets (black) at T*=0.51, c=1.2 mM, and eHBeHP=20. (f) Free energy as a function of hydrophobicity: eHBeHP=−20 (yellow), eHBeHP=50 (red), and eHBeHP=20 (blue) at T*=0.51, and c=4.9 mM.
Figure 3
Figure 3. Determination of the critical nuclei for β-sheet formation.
At different values of m, which is the number of interchain hydrogen bonds, we created an ensemble of up to 20 independent putative configurations for the nuclei and performed unbiased Monte Carlo simulations in order to measure the fraction of configurations that grow or shrink. Results are shown for c=4.9 mM, T*=0.45, and eHBeHP=50 (blue symbols), and for c=6.7 mM, T*=0.51, eHBeHP=20 (red symbols), which correspond to the nucleation barriers shown in Fig. 2c (green) and Fig. 2d (black) respectively; in the latter case, the polypeptide chains collapse into a disordered oligomer. (Inset) Gallery of nuclei comprising a number m of interchain hydrogen bonds close to the critical value for β-sheet formation; (top row) eHBeHP=50, m=10, and (bottom row) eHBeHP=20, m=11.
Figure 4
Figure 4. Schematic illustration of the condensation-ordering mechanism for polypeptide aggregation and amyloid formation.
The use of the progress variables n and m enables visualization of the competition between the initial condensation of polypeptide chains and their subsequent ordering into hydrogen-bonded cross-β structures. Different trajectories in the (n,m) space can be realized by variations of temperature, concentration, or the hydrophobicity of the polypeptide chains. Weakly hydrophobic polypeptide chains and even more hydrophobic ones at low concentrations aggregate directly into β-sheet structures (red arrows); this one-step process is a limiting case of the condensation-ordering mechanism. By contrast, hydrophobic polypeptide chains at higher concentrations form first oligomers (blue and green arrows), whose structure depends strongly on the temperature. At temperatures below their folding temperature, polypeptide chains are highly nativelike in the oligomer (blue arrows). An increase in the temperature leads to more disordered oligomers (green arrows). The colors are chosen as described in Fig. 1.
Figure 5
Figure 5. Schematic plot of a fluorescence signal
Initially, for times t smaller than a transient time θ, called the lag time, no fibrils are observed. After θ, the fluorescence signal IF increases with time and flattens out at later times because of the decrease of the concentration of proteins in the solution. The aggregation rate is usually taken to be the slope of IF in the linear regime: ISexp=ΔIF(t)Δt (indicated by the red dashed line), and the lag time θ is determined by the extrapolation to zero of the red dashed line. In the inset, we illustrate the effect of a change in the barrier for elongation on the total number of oligomers, N(t), formed in the solution. The solid lines are based on the analytical expression of Kashchiev (1969) and the dashed lines describe their long-time behavior based on Eq. 2. The values for the barriers for elongation are: ΔFekT*=0 (black), 1 (red), 2 (green), and 3 (blue), while all other parameters are unchanged. The unit time is set to be the lag time θ0 for ΔFe=0. In CNT, the steady-state nucleation rate is defined by: ISCNT=ΔN(t)Δt, and ISCNT and θ are determined, as in the experimental case, by the slope of the red dashed line and its extrapolation to zero, respectively. Hence, ISexp and ISCNT can be compared qualitatively.

References

    1. Auer, S, and Frenkel, D (2001). “Prediction of absolute crystallization rates in hard-sphere colloids.” Nature (London) NATUAS10.1038/35059035 409, 1020–1023. - DOI - PubMed
    1. Bader, R, Bamford, R, Zurdo, J, Luisi, B F, and Dobson, C M (2006). “Probing the mechanism of amyloidogenesis through a tandem repeat of the PI3-SH3 domain suggests a generic model for protein aggregation and fibril formation.” J. Mol. Biol. JMOBAK10.1016/j.jmb.2005.11.034 356, 189–208. - DOI - PubMed
    1. Ban, T, Hoshino, M, Takahashi, S, Hamada, D, Hasegawa, K, Naiki, H, and Goto, Y (2004). “Direct observation of A beta amyloid fibril growth and inhibition.” J. Mol. Biol. JMOBAK 344, 757–767. - PubMed
    1. Bieschke, J, Zhang, Q H, Powers, E T, Lerner, R A, and Kelly, J W (2005). “Oxidative metabolites accelerate Alzheimer’s amyloidogenesis by a two-step mechanism, eliminating the requirement for nucleation.” Biochemistry BICHAW 44, 4977–4983. - PubMed
    1. Blondelle, S E, Forood, B, Houghten, R A, and Perez-Paya, E (1997). “Polyalanine-based peptides as models for self-associated beta-pleated-sheet complexes.” Biochemistry BICHAW10.1021/bi963015b 36, 8393–8400. - DOI - PubMed

LinkOut - more resources