. 2008 Aug;2(4):205-19.
doi: 10.2976/1.2961038. Epub 2008 Aug 1.

Collective behavior in animal groups: theoretical models and empirical studies

Affiliations

Collective behavior in animal groups: theoretical models and empirical studies

Irene Giardina. HFSP J. 2008 Aug.

Abstract

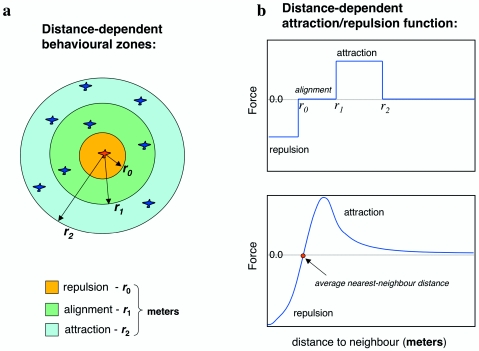
Collective phenomena in animal groups have attracted much attention in the last years, becoming one of the hottest topics in ethology. There are various reasons for this. On the one hand, animal grouping provides a paradigmatic example of self-organization, where collective behavior emerges in absence of centralized control. The mechanism of group formation, where local rules for the individuals lead to a coherent global state, is very general and transcends the detailed nature of its components. In this respect, collective animal behavior is a subject of great interdisciplinary interest. On the other hand, there are several important issues related to the biological function of grouping and its evolutionary success. Research in this field boasts a number of theoretical models, but much less empirical results to compare with. For this reason, even if the general mechanisms through which self-organization is achieved are qualitatively well understood, a quantitative test of the models assumptions is still lacking. New analysis on large groups, which require sophisticated technological procedures, can provide the necessary empirical data.


Figures

Figure 1
Figure 1. Behavioral rules in numerical models.
(a) Many models assume discrete behavioral zones in space where the three contributions, alignment, repulsion and attraction, take place. (b) Attraction∕repulsion force (fij in the text) as a function of the mutual distance between individuals. Upper panel: in models that assume behavioral zones the force is negative for distances smaller than the repulsion range r0, it is zero in the region where alignment takes place (r0<r<r1), and it is positive within the attraction zone. Lower panel: a schematic representation of a typical force function, repulsive at short range and attractive at larger distances. The equilibrium value where the force is zero (marked with a red dot) determines the average nearest-neighbor distance between individuals and therefore it fixes the density of the aggregation. The force decays to zero at large distances: the decay range plays the same role as the size of the attraction zone.
Figure 2
Figure 2. Transition from disorganized to organized collective motion as a function of the model parameters.
The quantity used to pinpoint the transition is the polarization, or global alignment, defined as the modulus of the average normalized velocity of the group 1Ni=1Nvi. In the Vicsek model only alignment is considered and the only two relevant parameters are the noise strength and density, defined as the number of individuals N divided by the whole volume of the simulation box. (a) Polarization as a function of the noise strength: for low noise a coherent moving group (large polarization) is present. (b) Polarization as a function of density: increasing density triggers the transition to collective motion. Reprinted figures from Vicsek T et al., Phys. Rev. Lett.75, 1226 (1995). Copyright 1995 by the American Physical Society. Reprinted with permission of the American Physical Society. (c) Change in polarization as the size of the zone of alignment is increased (bold line) or decreased (dotted line). Reprinted from Couzin ID et al., “Collective memory and spatial sorting in animal groups,” Journal of Theoretical Biology218, pp. 1–11. Copyright 2002, with permission from Elsevier. In this model the authors consider three distinct behavioral zones for repulsion, attraction, and alignment, plus a blind volume behind the focal individual. Only for large enough values of the alignment zone can the collective state be achieved. The degree of alignment depends on the increase∕decrease protocol used (hysteresis), which is typical of first order transitions. (d) Transition from a dispersed gas-like aggregation to a cohesive group in the model of Gregoire et al. (2003), where attraction/repulsion forces are used together with alignment of velocities. The figure shows the relative size of the largest cohesive cluster (number of individuals belonging to the cluster divided by total number of individuals) as a function of the strength of the attraction∕repulsion force. Reprinted from Gregoire G et al., “Moving and staying together without a leader,” Physica D181, pp. 157–170. Copyright 2003, with permission from Elsevier.
Figure 3
Figure 3. Transition from disorganized to collective motion in locust nymphs.
Locusts were placed in a ring-shaped arena and the alignment calculated as the average instantaneous orientation (relative to the center of the arena) for all moving individuals. Results of the experiment were compared with numerical simulations performed on a variant of the one-dimensional Vicsek model. (a) Mean alignment (averaged in time) as a function of the number of moving locusts; each point represents an experimental trial. (b) Distribution of the mean alignment in numerical simulations (1000 samples). The behavior of the instantaneous alignment is intermittent for intermediate values of the number of locusts, passing from aligned to unaligned states over time. (c) and (d) Total time spent in the aligned phase in experiments and simulations. From Buhl J et al. (2006), Science312, pp. 1402–1406. Reprinted with permission from AAAS.
Figure 4
Figure 4. A typical flock analyzed in the empirical study of Ballerini et al. (2008a).
This group consists of 1246 starlings, flying at approximately 70 m from the stereoscopic apparatus at about 11 ms−1. (a) and (b) Left and right photographs of the stereo pair, taken at the same instant of time, but 25 m apart. To perform the 3D reconstruction, each bird’s image on the left photo must be matched to its corresponding image on the right photo. Five matched pairs of birds are visualized by the red squares. Once the matching is performed, the 3D coordinates of each individual bird can be retrieved using stereometric formulas. (c) and (d) 3D reconstruction of the flock under two different points of view. Panel (d) shows the reconstructed flock under the same perspective as the right photograph (b). Reprinted from Ballerini M et al. (2008a), Proc. Natl. Acad. Sci. USA105, pp. 1232–1237. Copyright 2008, National Academy of Sciences of the USA.
Figure 5
Figure 5. To investigate the nature of the inter-individual interactions in starling flocks, Ballerini et al. (2008a) considered the interaction range measured in meters (metric range) and in number of intermediate neighbors (topological range), for several flocks with different average nearest-neighbor distance (NND) and, therefore, density.
(a) Topological interaction range n (to power −1∕3) as a function of the NND. (b) Metric interaction range as a function of NND. The topological range fluctuates around an average value (⟨n⟩=6.5), while the metric range is strongly correlated with NND. This shows that every bird interacts on average with 6–7 neighbors, irrespective of density. Figures reprinted from Ballerini M et al. (2008a), Proc. Natl. Acad. Sci. USA105, pp. 1232–1237. Copyright 2008, National Academy of Sciences of the USA. (c) and (d) Schematic illustration of a topological interaction: in two groups of different density the number of interacting neighbors is the same, but the metric interaction range is different.

References

    1. Allen, M P, and Tildesley, D J (1989). Computer Simulation of Liquids, Oxford University Press, Oxford.
    1. Amé, J M, Halloy, J, Rivault, C, Detrain, C, and Deneubourg, J L (2006). “Collegial decision making based on social amplification leads to optimal group formation.” Proc. Natl. Acad. Sci. U.S.A. PNASA6 103, 5835–5840. - PMC - PubMed
    1. Aoki, I (1980). “An analysis of the schooling behavior of fish: internal organization and communication process.” Bull. Ocean. Res. Inst. Univ. Tokyo12, 1–65.
    1. Aoki, I (1982). “A simulation study on the schooling mechanism in fish.” Bull. Jpn. Soc. Sci. Fish.48, 1081–1088.
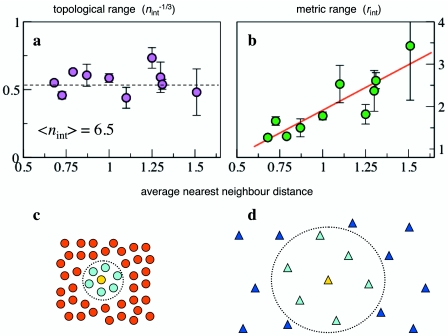
    1. Ballerini, M, Cabibbo, N, Candelier, R, Cavagna, A, Cisbani, E, Giardina, I, Lecomte, V, Orlandi, A, Parisi, G, Procaccini, A, Viale, M, and Zdravkovic, V (2008a). “Interaction ruling animal collective behaviour depends on topological rather than metric distance: evidence from a field study.” Proc. Natl. Acad. Sci. U.S.A. PNASA610.1073/pnas.0711437105 105, 1232–1237. - DOI - PMC - PubMed