. 2008 Oct;2(5):266-75.
doi: 10.2976/1.2974980. Epub 2008 Sep 15.

Light sheet-based fluorescence microscopy: more dimensions, more photons, and less photodamage

Affiliations

Light sheet-based fluorescence microscopy: more dimensions, more photons, and less photodamage

Emmanuel G Reynaud et al. HFSP J. 2008 Oct.

Abstract

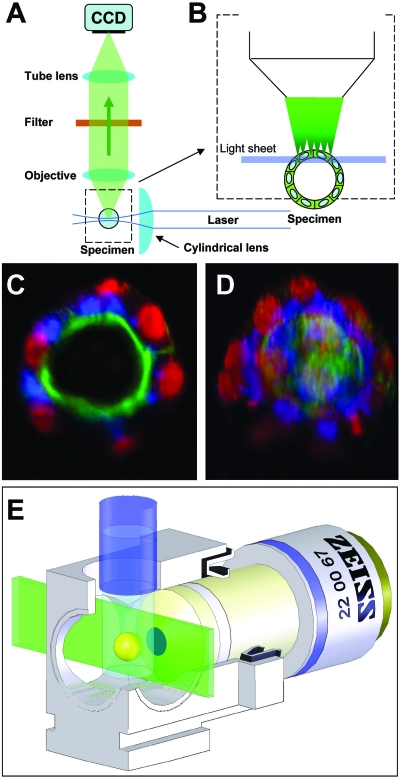
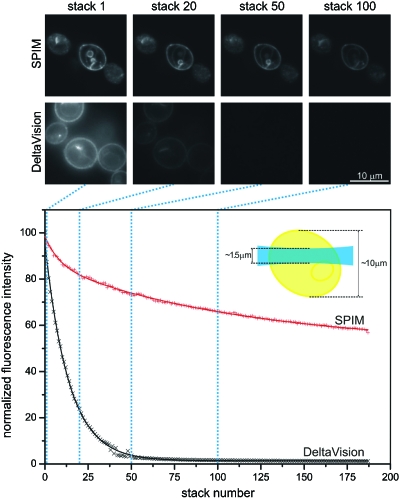
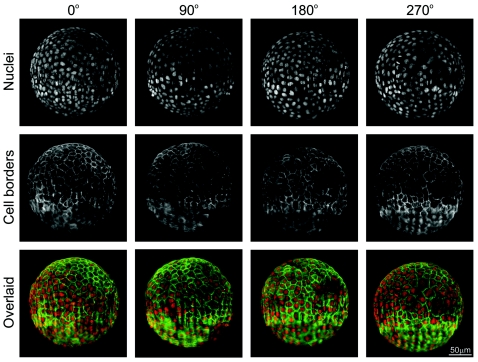
Light-sheet-based fluorescence microscopy (LSFM) is a fluorescence technique that combines optical sectioning, the key capability of confocal and two-photon fluorescence microscopes with multiple-view imaging, which is used in optical tomography. In contrast to conventional wide-field and confocal fluorescence microscopes, a light sheet illuminates only the focal plane of the detection objective lens from the side. Excitation is, thus, restricted to the fluorophores in the volume near the focal plane. This provides optical sectioning and allows the use of regular cameras in the detection process. Compared to confocal fluorescence microscopy, LSFM reduces photo bleaching and photo toxicity by up to three orders of magnitude. In LSFM, the specimen is embedded in a transparent block of hydrogel and positioned relative to the stationary light sheet using precise motorized translation and rotation stages. This feature is used to image any plane in a specimen. Additionally, multiple views obtained along different angles can be combined into a single data set with an improved resolution. LSFMs are very well suited for imaging large live specimens over long periods of time. However, they also perform well with very small specimens such as single yeast cells. This perspective introduces the principles of LSFM, explains the challenges of specimen preparation, and introduces the basics of a microscopy that takes advantage of multiple views.


Figures

Figure 1
Figure 1. Comparison of imaging methods based on their resolution or precision.
Precision methods are, e.g., stimulated emission depletion (STED) (Willig et al., 2006), photoactivated localization microscopy (PALM) (Betzig et al., 2006), and stochastic optical reconstruction microscopy (STORM) (Rust et al., 2006). MRI—magnetic resonance imaging, PET—positron emission tomography, OPT—optical projection tomography (Sharpe et al., 2002), OCT—optical coherence tomography, LSFM—light-sheet-based fluorescence microscopy, dmvLSFM—deconvolved multiple views light-sheet-based fluorescence microscopy. Figure inspired by Roger Tsien (Tsien 2003).
Figure 2
Figure 2. The LSFM principle.
(A) The central element of an LSFM is a regular fluorescence microscope. It consists of an objective lens, a filter, a tube lens, and a wide-field detector. The specimen is illuminated from the side by focusing a collimated laser beam to a light sheet with a cylindrical lens. (B) In the specimen, only those fluorophores that are actually observed are also illuminated. This is equivalent to a true optical sectioning but does not generate photo damage outside the focal plane. (C) A single image out of a stack of 120 planes, which was recorded inside a fixed MDCK cyst, demonstrates the optical sectioning capability, the excellent signal to noise ratio, and the extremely low background. (Red: DRAQ5 staining of the nuclei; blue: GM130 antibody staining of the Golgi apparatus; green: Phalloidin-Alexa488 of the actin network). (D) Projection of the stack of 120 images recorded at different depths. (E) A picture of a setup showing the incubation chamber and the specimen during imaging.
Figure 3
Figure 3. A semiquantitative comparison of photo bleaching rates in a SPIM and a regular widefield fluorescence microscope.
The yeast cells stably expressed Ady2-myeGFP. A stack of 46 planes was acquired every 8 sec. A total of 190 stacks were recorded with a SPIM using a Carl Zeiss Achroplan 100×∕1.0 W lens and an Orca ER CCD camera. The imaging conditions on the two microscopes were adapted to provide comparable signal to noise ratios at comparable excitation intensities. The excitation wavelength was 488 nm while the fluorescence emission was recorded above 510 nm. The calculation of the fluorescence intensity (crosses in the graph) was performed in the central plane of a yeast cell. The measurements were fitted with a double exponential decay function (solid lines). The fluorescence decay in the widefield microscope was approximately six higher than in the SPIM. This number is supported by the fact that only one-sixth of the whole yeast cell is illuminated by the light sheet in SPIM (see the graph inlet) while the widefield microscope illuminates the whole cell for every image recorded. The ratio in bleaching rates is, therefore, even bigger for larger specimens. It should be stressed that the imaging conditions in such experiments will never be perfect since the sample preparation conditions and samples themselves tend to vary naturally. The yeast cells were obtained and imaged in collaboration with Christof Taxis and Michael Knop.
Figure 4
Figure 4. Multiple-view imaging of a Cytodex microcarrrier in a SPIM.
MDCK cells that stably express an E-cadherin EGFP construct were grown on a Cytodex 3 microcarrier (mean diam. 200 μm, GE Healthcare) for two weeks prior to imaging with the SPIM. The nuclei were stained with Draq5 (Biostatus), the cell borders and, thus, the locations of the cells’ outer plasma membrane are highlighted by the E-cadherin EGFP expression. The Cytodex bead was fixed in paraformaldehyde and then embedded in 1% agarose in a capillary (inner diam. 1,1 mm) It was imaged using a 20× objective (Zeiss Achroplan; NA 0.5) along four angles (0, 90, 180, and 270 deg). Each three-dimensional stack of images consists of 1,033 images (z spacing, 0,32 μm). The total multiple-views super set of images represents 4,132 images (i.e., 1,1 GB).
Figure 5
Figure 5. The building units of an LSFM.
The detection unit is a simplified fluorescence wide-field microscope. An objective lens, a filter, and a tube lens form the fluorescence image on the wide-field detector (e.g., a CCD camera). The objective lens defines the focal plane. The illumination unit generates the light sheet for the illumination of the volume around the focal plane in the specimen. The movement unit holds the specimen and moves it relative to the optical setup, which is usually at rest. Three translation and one rotation stage position scan the specimen. The specimen can be immersed in a medium-filled chamber for optimal experimental conditions. Finally, the control unit, a standard computer equipped with data acquisition boards, controls the hardware and acquires the data. Additional optical elements such as beam couplers and splitters for auxiliary units can be introduced in the infinity corrected space (ICS) between the objective lens and the tube lens and will require further lasers and other optical components not shown here (Nanotool port) (m: mirror).
Figure 6
Figure 6. Different specimen preparation techniques for LSFM.
(A) The simplest method is hooking or clipping the specimen in front of the objective. (B) The specimen can be embedded into a cylinder of gelling agent such as low melting agarose. (C) The specimen can be contained into a chamber made of agarose or a transparent polymer. (D) Finally, the specimen can be prepared and fixed on a coverslip and imaged at an angle in regard to the light sheet.

References

    1. Betzig, E, Patterson, G H, Sougrat, R, Lindwasser, O W, Olenych, S, Bonifacino, J S, Davidson, M W, Lippincott-Schwartz, J, and Hess, H F (2006). “Imaging intracellular fluorescent proteins at nanometer resolution.” Science SCIEAS10.1126/science.1127344, 313(5793), 1642–1645. - DOI - PubMed
    1. Breuninger, T, Greger, K, and Stelzer, E H (2007). “Lateral modulation boosts image quality in single plane illumination fluorescence microscopy.” Opt. Lett. OPLEDP10.1364/OL.32.001938 32, 1938–1940. - DOI - PubMed
    1. Colombelli, J, Pepperkok, R, Stelzer, E H, and Reynaud, E G, (2006). “La nanochirurgie laser.” Médecine Sciences, 22(6–7), 651–658. - PubMed
    1. Colombelli, J, Reynaud, E G, Rietdorf, J, Pepperkok, R, and Stelzer, E H (2005). “In vivo selective cytoskeleton dynamics quantification in interphase cells induced by pulsed ultraviolet laser nanosurgery.” Traffic 6, 1093–1102. - PubMed
    1. Dodt, H U, Leischner, U, Schierloh, A, Jährling, N, Mauch, C P, Deininger, K, Deussing, J M, Eder, M, Zieglgänsberger, W, and Becker, K (2007). “Ultramicroscopy: three-dimensional visualization of neuronal networks in the whole mouse brain.” Nat. Methods ZZZZZZ 4, 331–336. - PubMed

LinkOut - more resources