. 2007 May;1(1):79-87.
doi: 10.2976/1.2739116/10.2976/1. Epub 2007 May 21.

A structural model of latent evolutionary potentials underlying neutral networks in proteins

A structural model of latent evolutionary potentials underlying neutral networks in proteins

Richard Wroe et al. HFSP J. 2007 May.

Abstract

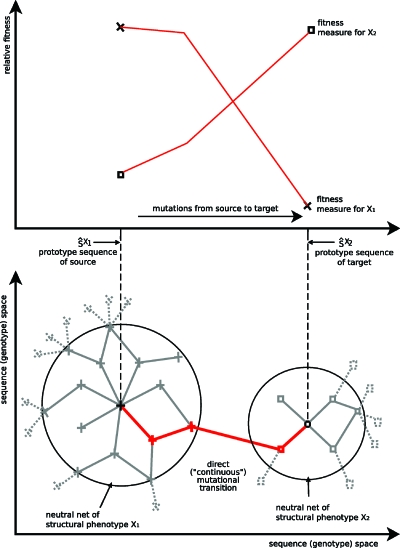
A central question in molecular evolution concerns the nature of phenotypic transitions, in particular, if neutral mutations hamper or somehow facilitate adaptability of proteins to new requirements. Proteins have been found to fluctuate between different structures, with frequencies of structures being proportional to their stability. Therefore, functional promiscuity may correspond to different structures with energies close to the ground state which then represent multiple selectable traits. We here postulate that these near-ground-state structures facilitate smooth transitions between phenotypes. Using a biophysical heteropolymer model with exhaustive mappings of sequences onto structures, we demonstrate that this is indeed possible because of a smooth gradient of stability along which any structural phenotype can be optimized and also because of mutational proximity of similar phenotypes in genotype space. Our model provides a biophysical rationalization of the intriguing, and otherwise puzzling experimental observation that adaptation to new requirements, e.g., latent function of a promiscuous enzyme, can proceed while the "old," phenotypically dominant function is maintained along a series of seemingly neutral mutations (see accompanying article). Thus pleiotropy may facilitate adaptation of latent traits before gene duplications and increase the effective adaptability of proteins.


Figures

Figure 1
Figure 1. Schematics of evolutionary transitions between neutral nets.
Top: possible development of the relative fitness (e.g., a selected enzyme activity or structural similarity to a target) during adaptation of a population which was initially optimal for one function (×, left) and then selected for another function (target: ◻, right), similar to the situation investigated by the experiments of Aharoni et al. (2005). Bottom: an interpretation in terms of structural phenotypes according to Maynard-Smith’s idea of a continuous phenotype space (there is one direct transition from one representative of one structural phenotype to the other) and the superfunnel paradigm (genotypes depicted in the center have more neutral neighbors and code for thermodynamically most stable structures). The two big circles denote the boundaries of the neutral nets of the two structural phenotypes (× and ◻). Every genotype within one neutral net codes uniquely for the same structural phenotype and point mutations among them are indicated by solid lines; mutations that result in a sequence outside the neutral net are represented by dashed lines. Mutations along solid lines are commonly referred to as neutral as long as they stay within one neutral net. A mutation is termed adaptive at the transition, i.e., when it changes the phenotype. The top and bottom drawings are positioned to show the correspondence between the concept proposed in this work and the superfunnel paradigm. The solid red evolutionary path indicated in the bottom drawing corresponds to the fitness paths in the top drawing. Initially, evolution seems neutral because the same phenotype dominates although it becomes less frequent in the structural ensemble (the fractional population is reduced) and the phenotype which is selected for gradually becomes more frequent in the structural ensemble.
Figure 2
Figure 2. Population dynamics with excited-state selections for uniquely folding
g=1 sequences. The genotypes evolve from a homogeneous starting population of identical copies of the prototype sequence for structure A toward the target neutral net for structure C. (a): phenotypes A, B, and C are modeled by structures of lattice proteins, depicted here in their corresponding prototype sequences. Black circles symbolize hydrophobic residues, which stabilize structures if and only if they are nearest neighbors on the lattice but not along the chain. The originating structure A has nine such stabilizing intrachain contacts between hydrophobic residues. Structure A has no common intrachain contact with the target structure C. For instance, the two chain ends are in contact in structure A, but one of the chain ends is not in contact with any residue in structure C. The thick solid curve shows the average structural similarity (measured by the number of shared intrachain contacts) between the target structure and the structures encoded by all of the sequences in the population as a function of evolutionary generation. In this simulation, maximum structural similarity is achieved after two major transitions (at approximately generation 32 and 52) by traversing the neutral net of structure B (top drawing, shown with its prototype sequence), which is dominantly populated at an intermediate stage of this evolutionary process (middle plateau). The thick dashed curve provides the average sequence similarity of all sequences to the target, measured by the Hamming distance h(Si,S^C) to the prototype sequence S^C for target structure C. The upper and lower dotted curves give, respectively, the maximum and minimum similarity of the sequences in the population to S^C. While the population drifts along network A, the changing sequence similarity indicates that it is getting closer to the target but structurally the vast majority of the sequences still stay on the neutral network for structure A. (b): The average pairwise Hamming distance between all pairs of sequences in the population. (c): Number of sequences (out of 1000), which code uniquely for structure A (solid curve), B (dotted), and C (dashed) as functions of generation. All population dynamics simulations in this work were conducted using α=106 for the selection gradient parameter in Eq. 1, and T=−ϵ∕0.5kB, where ϵ is the HH contact energy in the HP model (Bornberg-Bauer and Chan, 1999).
Figure 3
Figure 3. Population dynamics without excited-state selections is around 40 times slower than with using excited states.
Same as Fig. 2 (middle) but now selection for the target structure is turned off unless the sequence is already in the neutral net of the target structure, i.e., F(Si)=1 unless Si is in the target neutral net. The average sequence and structural similarities are given, respectively, by the upper and lower trajectories in this plot.
Figure 4
Figure 4. Average pairwise structural similarity of phenotypes is measured by the number of identical intrachain contacts and shown as a function of sequence dissimilarity (Hamming distance) between the two prototype sequences that encode the pair of structures.
The dotted horizontal line here marks the level of random structural similarity obtained by averaging over all possible pairs of phenotypes.
Figure 5
Figure 5. Relative stabilities of optimal and suboptimal structures along mutational paths from one prototype sequence to another.
(a): Relative stabilities of structures X1 and X2 along a typical mutational path from the prototype sequence S^X1 (sequence position 1, left) to another prototype sequence S^X2 (sequence position 7, right). Data points joined by solid and dashed lines denote, respectively, ΔG(X2T,Si) and ΔG(X1T,Si), in units of kBT, where T=−ϵ∕5kB. We refer to a single-point mutational step along a viable path from sequence Si to sequence Si′ as a “favorable” move for a structure Xj if ΔiijG(XjT,Si)−ΔG(XjT,Si)]≤0 and when the Hamming distance between Si and the prototype sequence S^Xj of structure Xj is shorter than or equal to that between Si and S^Xj, i.e., h(Si,S^Xj)h(Si,S^Xj). Otherwise, the mutational step is referred to as “unfavorable.” Only one of the 12 moves (solid and dashed lines) shown is slightly unfavorable (solid line between sequences 4 and 5). Two are essentially neutral (solid line between sequences 2 and 3, dashed line between sequences 6 and 7). All others are favorable. The increasing stability of structure X2 toward S^X2 and of structure X1 toward S^X1 correspond to typical superfunnel behaviors as in Figs. 2(a) and 5 of Bornberg-Bauer and Chan (1999). Included for comparison are the stability values (circles, joined by dotted line) of a structure that has the second lowest energy among all possible conformations that can be adopted by sequence 7 (S^X2). Stability and fractional population of this structure decreases (free energy increases) as the sequence moves away from S^X2. (b): Distribution of favorable, indifferent, and unfavorable moves, binned in units of ΔiijkBT (horizontal axis), among all 28,208 single-point mutational steps along all 1714 direct paths between pairs of prototype sequences. Around half (51.0%) of the moves are nearly indifferent (Δiij0kBT), but almost the same fraction (48.7%) are strongly favorable (Δiij<1kBT) whereas only a negligible fraction (0.3%) are strongly unfavorable (Δiij>1kBT).

References

    1. Aharoni, A, Gaidukov, L, Khersonsky, O, Gould, S M, Roodveldt, C, and Tawfik, DS (2005). “The ‘evolvability’ of promiscuous protein functions.” Nat. Genet. NGENEC 37, 73–76. - PubMed
    1. Amitai, G, Gupta, R, and Tawfik, D S (2007). “Latent evolutionary potentials under the neutral mutational drift of an enzyme.” HFSP J. HJFOA5 1, 67–78. - PMC - PubMed
    1. Bai, Y, Sosnick, T R, Mayne, L, and Englander, S W (1995). “Protein folding intermediates: native-state hydrogen exchange.” Science SCIEAS10.1126/science.7618079 269, 192–197. - DOI - PMC - PubMed
    1. Barabasi, A L, and Oltvai, Z N (2004). “Network biology: understanding the cell’s functional organization.” Nat. Rev. Genet. NRGAAM10.1038/nrg1272 5, 101–113. - DOI - PubMed
    1. Bastolla, U, Roman, H E, and Vendruscolo, M (1999). “Neutral evolution of model proteins: diffusion in sequence space and overdispersion.” J. Theor. Biol. JTBIAP10.1006/jtbi.1999.0975 200, 49–64. - DOI - PubMed

LinkOut - more resources