. 2009 Apr 30:10:204.
doi: 10.1186/1471-2164-10-204.

In silico miRNA prediction in metazoan genomes: balancing between sensitivity and specificity

Affiliations

In silico miRNA prediction in metazoan genomes: balancing between sensitivity and specificity

Ate van der Burgt et al. BMC Genomics. .

Abstract

Background: MicroRNAs (miRNAs), short approximately 21-nucleotide RNA molecules, play an important role in post-transcriptional regulation of gene expression. The number of known miRNA hairpins registered in the miRBase database is rapidly increasing, but recent reports suggest that many miRNAs with restricted temporal or tissue-specific expression remain undiscovered. Various strategies for in silico miRNA identification have been proposed to facilitate miRNA discovery. Notably support vector machine (SVM) methods have recently gained popularity. However, a drawback of these methods is that they do not provide insight into the biological properties of miRNA sequences.

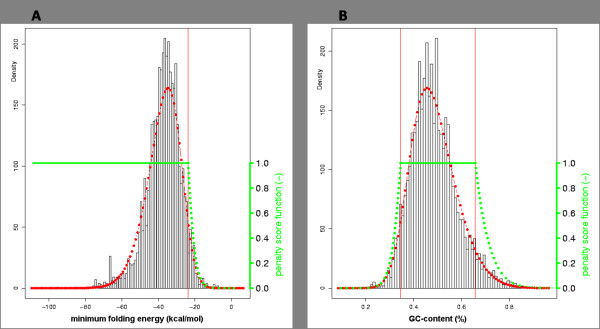
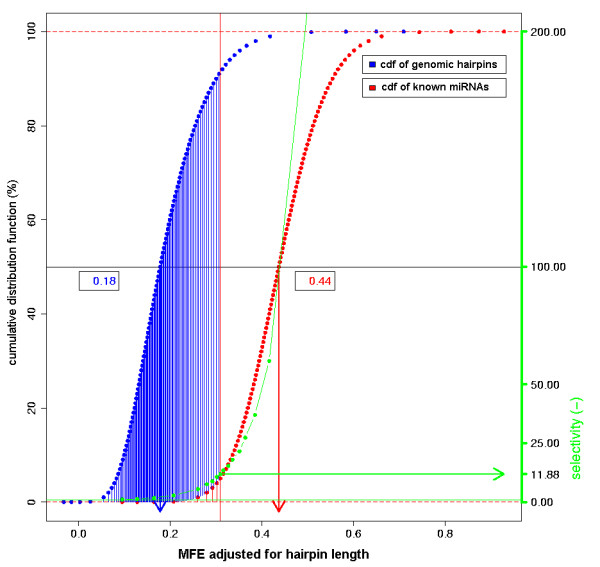
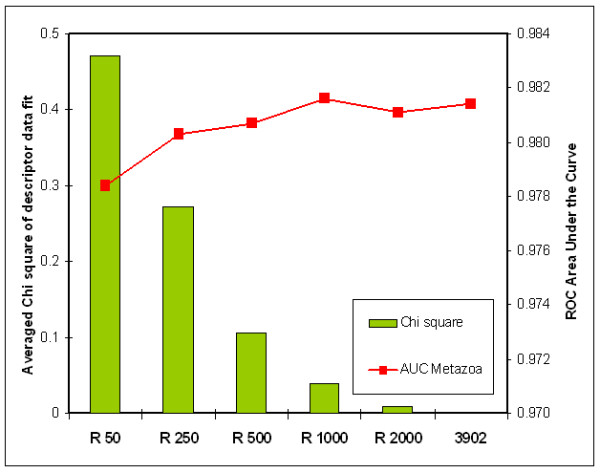
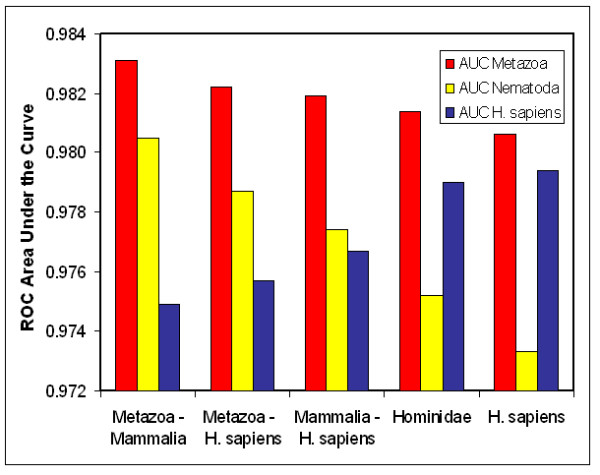
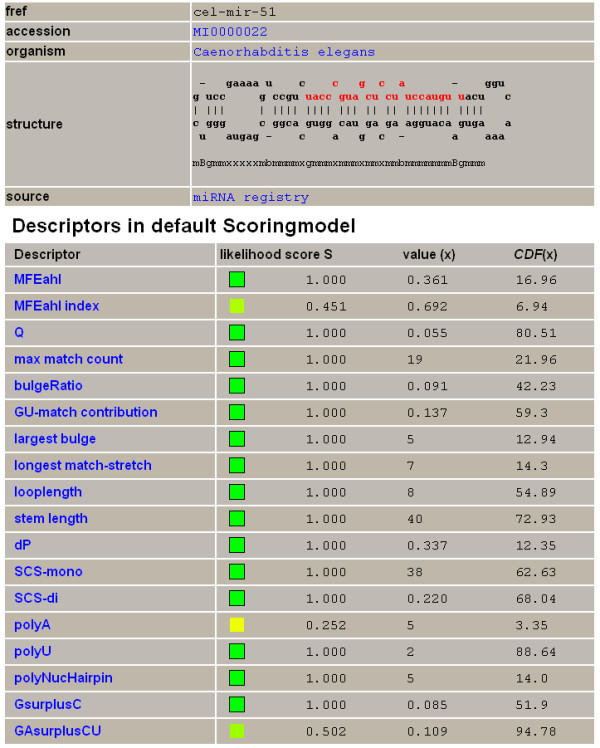
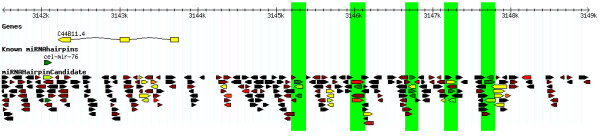
Results: We here propose a new strategy for miRNA hairpin prediction in which the likelihood that a genomic hairpin is a true miRNA hairpin is evaluated based on statistical distributions of observed biological variation of properties (descriptors) of known miRNA hairpins. These distributions are transformed into a single and continuous outcome classifier called the L score. Using a dataset of known miRNA hairpins from the miRBase database and an exhaustive set of genomic hairpins identified in the genome of Caenorhabditis elegans, a subset of 18 most informative descriptors was selected after detailed analysis of correlation among and discriminative power of individual descriptors. We show that the majority of previously identified miRNA hairpins have high L scores, that the method outperforms miRNA prediction by threshold filtering and that it is more transparent than SVM classifiers.

Conclusion: The L score is applicable as a prediction classifier with high sensitivity for novel miRNA hairpins. The L-score approach can be used to rank and select interesting miRNA hairpin candidates for downstream experimental analysis when coupled to a genome-wide set of in silico-identified hairpins or to facilitate the analysis of large sets of putative miRNA hairpin loci obtained in deep-sequencing efforts of small RNAs. Moreover, the in-depth analyses of miRNA hairpins descriptors preceding and determining the L score outcome could be used as an extension to miRBase entries to help increase the reliability and biological relevance of the miRNA registry.


Figures

Figure 1
Figure 1
Data fit and likelihood distribution function for two descriptors. Frequency distribution (black bars), SN-fitted distribution (red curve) and likelihood distribution function (LDF) (green curve) for descriptors MFE (A) and GC-content (B) of the taxonomic set Metazoa (3,902 miRNA hairpins). Red vertical lines mark the upper and lower 5% tails of the distribution.
Figure 2
Figure 2
Discriminative power of the descriptor MFEahl. Red curve represents the CDF of the descriptor MFEahl for the taxonomic set Metazoa (3,902 miRNA hairpins). Blue curve represents the CDF of the SN-fitted distribution of the same descriptor in case of 100,000 randomly selected hairpins from the C. elegans genome. Green curve represents the discriminative power, calculated as sensitivity/(1.0-specificity). The fraction of hairpins in the S < 1 fraction is shaded (S < 1 cut-off at 95% of the CDF of known miRNA hairpins). The discriminative power at 95% sensitivity is shown by a green arrow (13.33). SN-fitted means are shown by red (0.44) and blue (0.18) arrows.
Figure 3
Figure 3
Accuracy of fit and scoring model performance depends on the size of the input set. AUC performance (red line) and average Chi-square accuracy of fit of 40 descriptors (green bars), using six scoring models that were based on varying sizes of the input set. Input-set sizes are indicated with a prefix 'R' and comprised 50, 250, 500, 1000, 2000, and the complete set (3,902) of metazoan miRNA hairpins. The smaller sets were compiled by randomly selecting miRNA hairpins from the complete set. This was repeated 50 times for each set. The accuracy of fit was then calculated by averaging Chi-square test statistics over all 40 descriptors and the 50 randomly selected subsets of each indicated size. Both AUC performance and Chi-square statistics show a strong dependency on Input-set size.
Figure 4
Figure 4
Scoring model performance depends on the taxonomic distance of the input set. AUC performance of five different scoring models that vary in the distance of the taxonomic input set. Area under the ROC curves is measured for the taxonomic sets Metazoa (red), Nematoda (yellow) and H. sapiens (blue) versus 200,000 randomly selected hairpins from the set of 3,526,115 C. elegans hairpins. Scoring models "X – Y" have as taxonomic input set all miRNA hairpins from set X after removal of set Y. From these subsets (and the set Hominidae) 781 miRNA hairpins have been randomly selected. The results presented for the random subsets are averages from 50 independent repeats.
Figure 5
Figure 5
Scoring model performance depends on the correlation of descriptors. Discriminative power of three individual and three pairs of descriptors. For the descriptor pairs, Cohen's kappa coefficients are also given. Selectivity is expressed at 95% sensitivity on the set of all metazoan miRNA hairpins; specificity is measured on the set of 3,526,115 hairpins in the genome of C. elegans.
Figure 6
Figure 6
Scoring model performance depends on LDF parameterization and weighting of descriptors. AUC performance and selectivity of six different scoring models that vary in parameterization of the LDF (95-90-80%) and have no weighted (weight = 1.0) or weighted individual descriptors (W). Weights were adjusted to the square root of the descriptor's discriminative power as measured at a sensitivity of 95% (Table 1). The square root was taken to prevent disproportionate influence of descriptors with high discriminative power. All models have the same input set (3,902 metazoan miRNA hairpins) and are based on the previously selected set of 18 descriptors. Selectivity is expressed at 95% (purple) and 75% (blue) sensitivity on the set of all metazoan miRNA hairpins; specificity is measured on the set of 3,526,115 hairpins in the genome of C. elegans. Relative values of selectivity are presented with the initial scoring model taken as index (selectivity of 12.6 at 95% and 74.1 at 75% sensitivity).
Figure 7
Figure 7
ROC-curve of the L-score classifier of two different scoring models. ROC curve of the L-score classifier of the final scoring model Metazoa (red) and the initial model without weighting and default parameterization (blue). True positives are measured on the taxonomic set Metazoa (3,902 miRNA hairpins), false positives on 500,000 randomly selected genomic hairpins from C. elegans.
Figure 8
Figure 8
Cumulative L-score plot of two different scoring models. Ratio of miRNA hairpins in the taxonomic set Metazoa (3,902) that have an L score of at least a certain value. Data are shown for the final scoring models Metazoa (red) and the initial model without weighting and default parameterization (blue).
Figure 9
Figure 9
Detailed descriptor analyses report for cel-mir-38. Detailed report for the observed descriptor values of cel-mir-38 in the scoring model Metazoa (L score = 0.057). For each descriptor, a color-coded representation of the likelihood score S, the actual value of S, the actual observed descriptor value and the position of this value in the CDF of the descriptor are given. Descriptors MFEahl index, polyA and GAsurplusCU are in the S<1 fraction outside 90% of the CDF.
Figure 10
Figure 10
A cluster of candidate miRNA hairpins in C. elegans 3 kb upstream of cel-mir-76. Five candidate miRNA hairpin loci with L score = 1 on chromosome III of C. elegans, selected by the filtering protocol Clustered. Loci are marked by green bars. Three out of five loci have hairpins with L score = 1 on both strands (positive strand: 3145224–3145336, 3146698–3146781, 3147197–3147283 and 3147660–3147798; negative strand: 3145240–3145320, 3145991–3146089, 3146703–3146775 and 3147690–3147767). The L score of genomic hairpins is indicated by a color gradient that ranges from dark green (L = 1) over yellow (L = 1e-4) and red (L = 5e-7) to black (L = 0).
Figure 11
Figure 11
Candidate miRNA hairpins in C. elegans closely related to cel-mir-266 and cel-mir-269. ClustalW alignment of the hairpin sequences of cel-mir-266, cel-mir-269 and the genomic hairpins 1,165,306 (chr I, 1733470..1733572 (+), L score = 0.030, 12th intron of F54F11.2) and 2,047,661 (chr II, 13515555..13515672 (+), L score = 7.2E-3, 7th intron of Y71G12B.11). The position of the mature miRNA sequences of cel-mir266 and cel-mir-269 (in lowercase) is projected on the sequences in green. Lowest two lines show again the mature miRNA sequences of cel-mir-266 (MIMAT0000325) and cel-mir-269 (MIMAT0000322), with their seed sequence in uppercase.

Similar articles

Cited by

References

    1. Bartel DP. MicroRNAs: genomics, biogenesis, mechanism, and function. Cell. 2004;116:281–297. doi: 10.1016/S0092-8674(04)00045-5. - DOI - PubMed
    1. Pfeffer S, Sewer A, Lagos-Quintana M, Sheridan R, Sander C, Grasser FA, van Dyk LF, Ho CK, Shuman S, Chien M, et al. Identification of microRNAs of the herpesvirus family. Nature methods. 2005;2:269–276. doi: 10.1038/nmeth746. - DOI - PubMed
    1. Zeng Y, Cullen BR. Efficient processing of primary microRNA hairpins by Drosha requires flanking nonstructured RNA sequences. The Journal of biological chemistry. 2005;280:27595–27603. doi: 10.1074/jbc.M504714200. - DOI - PubMed
    1. Berezikov E, Plasterk RH. Camels and zebrafish, viruses and cancer: a microRNA update. Human molecular genetics. 2005;14:R183–190. doi: 10.1093/hmg/ddi271. - DOI - PubMed
    1. Lim LP, Lau NC, Weinstein EG, Abdelhakim A, Yekta S, Rhoades MW, Burge CB, Bartel DP. The microRNAs of Caenorhabditis elegans. Genes & development. 2003;17:991–1008. doi: 10.1101/gad.1074403. - DOI - PMC - PubMed

LinkOut - more resources