Clinical Trial
. 2009 May;90(5):717-25.
doi: 10.1016/j.apmr.2008.11.013.

Lower thoracic spinal cord stimulation to restore cough in patients with spinal cord injury: results of a National Institutes of Health-sponsored clinical trial. Part I: methodology and effectiveness of expiratory muscle activation

Affiliations
Clinical Trial

Lower thoracic spinal cord stimulation to restore cough in patients with spinal cord injury: results of a National Institutes of Health-sponsored clinical trial. Part I: methodology and effectiveness of expiratory muscle activation

Anthony F DiMarco et al. Arch Phys Med Rehabil. 2009 May.

Abstract

Objective: Evaluation of the capacity of lower thoracic spinal cord stimulation (SCS) to activate the expiratory muscles and generate large airway pressures and high peak airflows characteristic of cough, in subjects with tetraplegia.

Design: Clinical trial.

Setting: Inpatient hospital setting for electrode insertion; outpatient setting for measurement of respiratory pressures; home setting for application of SCS.

Participants: Subjects (N=9; 8 men, 1 woman) with cervical spinal cord injury and weak cough.

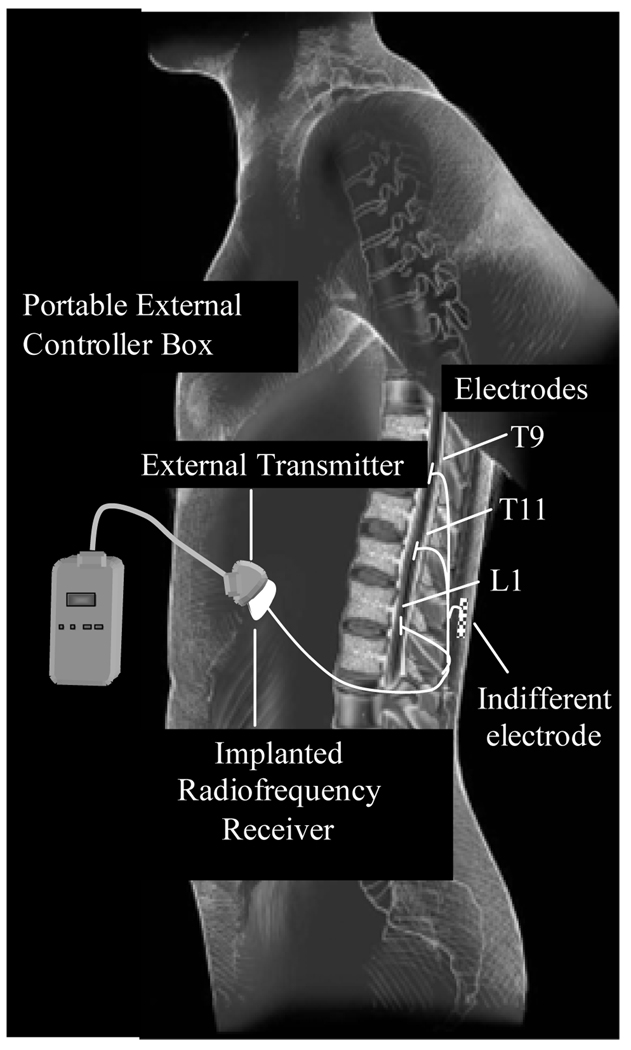
Interventions: A fully implantable electrical stimulation system was surgically placed in each subject. Partial hemilaminectomies were made to place single-disk electrodes in the epidural space at the T9, T11, and L1 spinal levels. A radiofrequency receiver was placed in a subcutaneous pocket over the anterior portion of the chest wall. Electrode wires were tunneled subcutaneously and connected to the receiver. Stimulation was applied by activating a small portable external stimulus controller box powered by a rechargeable battery to each electrode lead alone and in combination.

Main outcome measures: Peak airflow and airway pressure generation achieved with SCS.

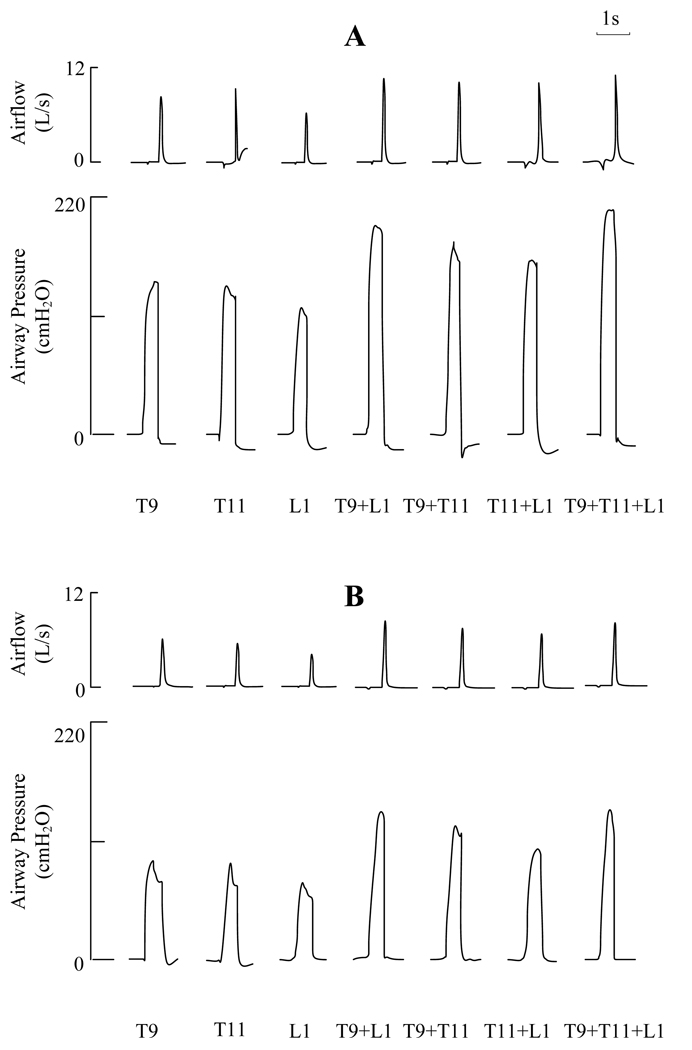
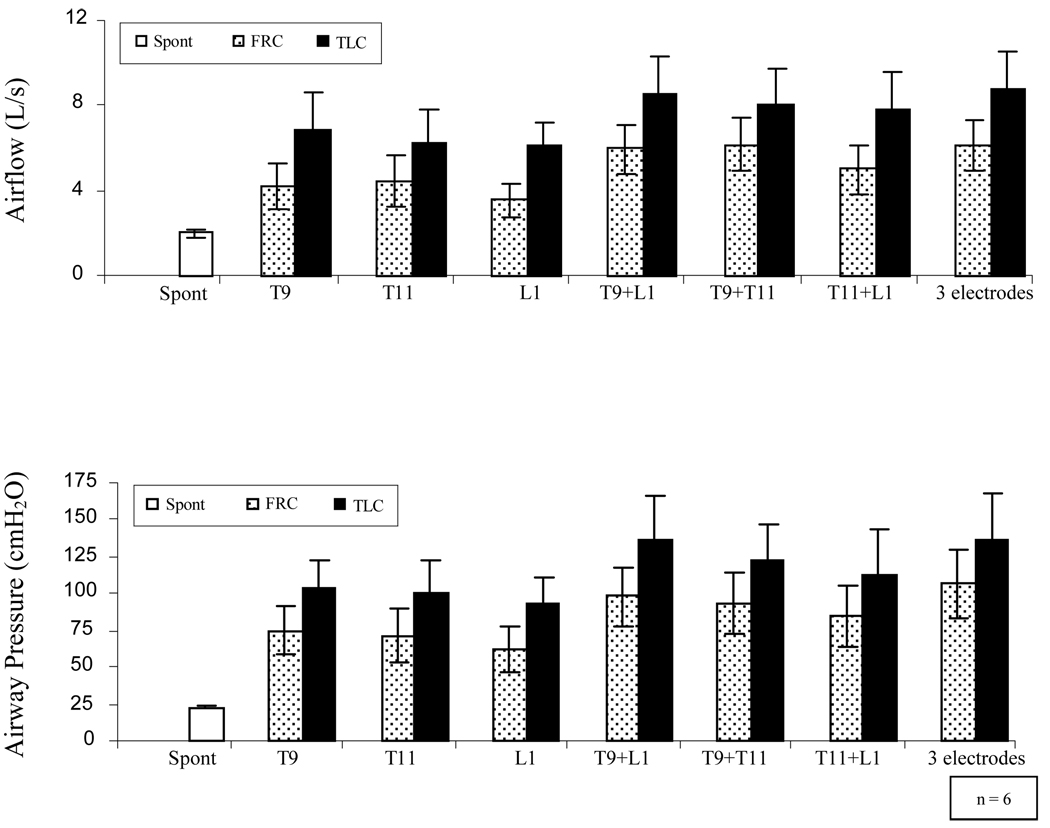
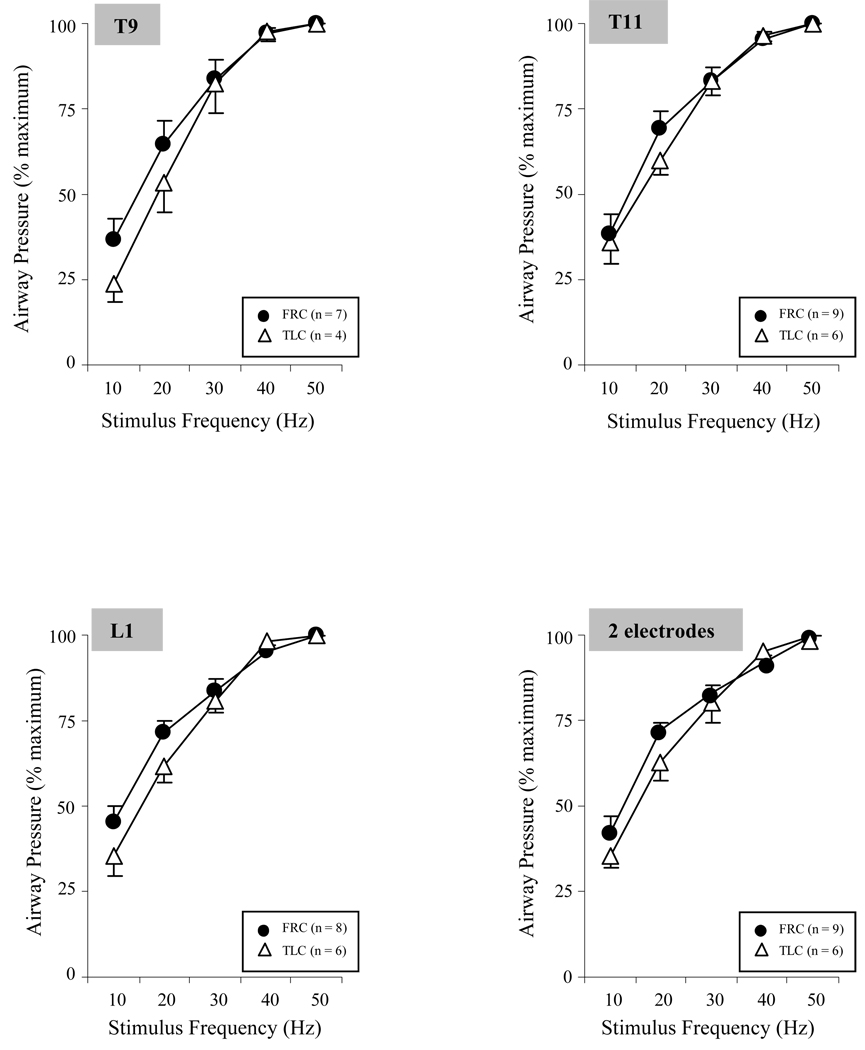
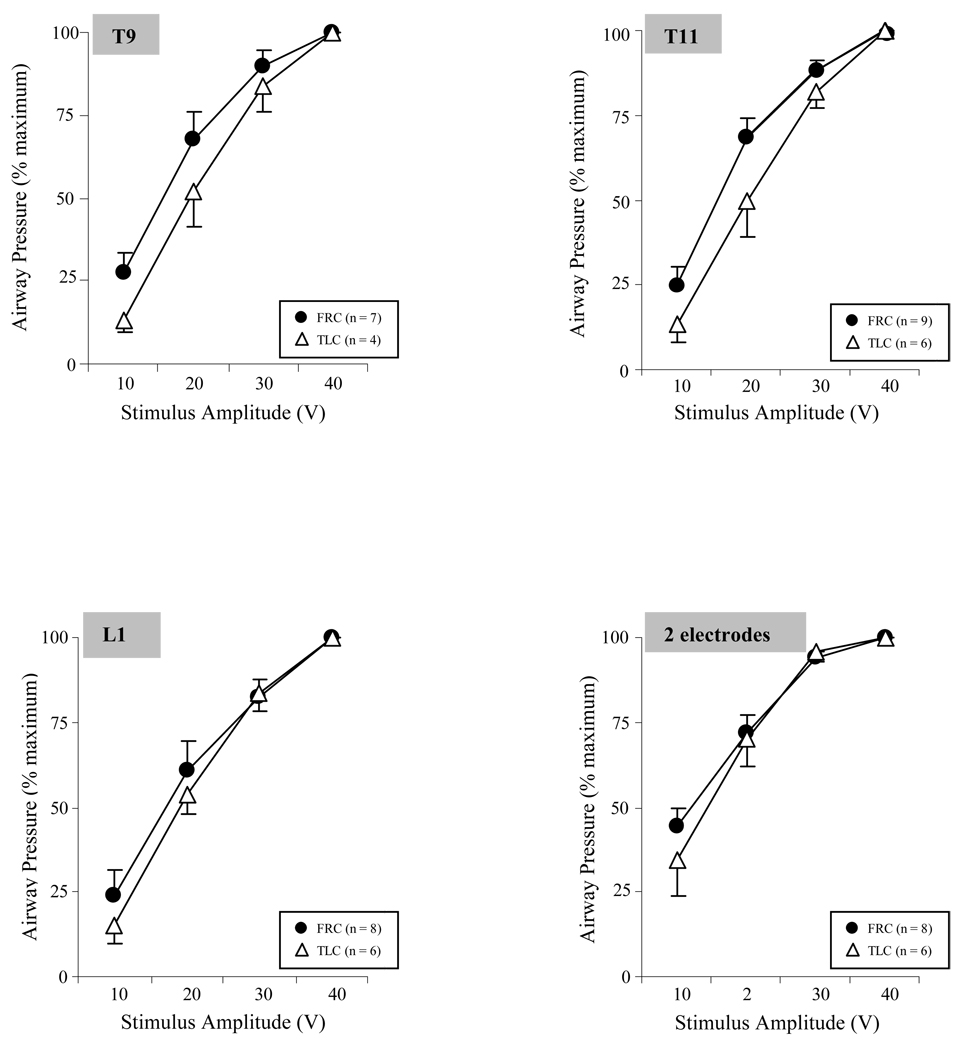
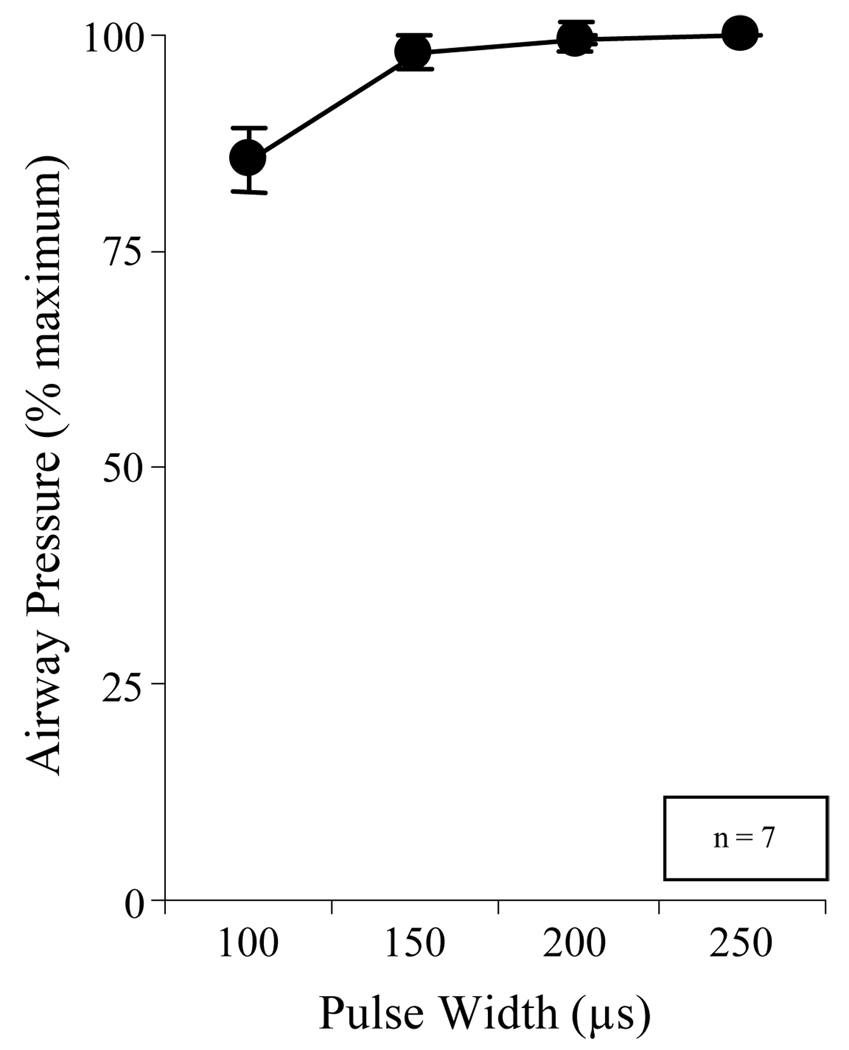
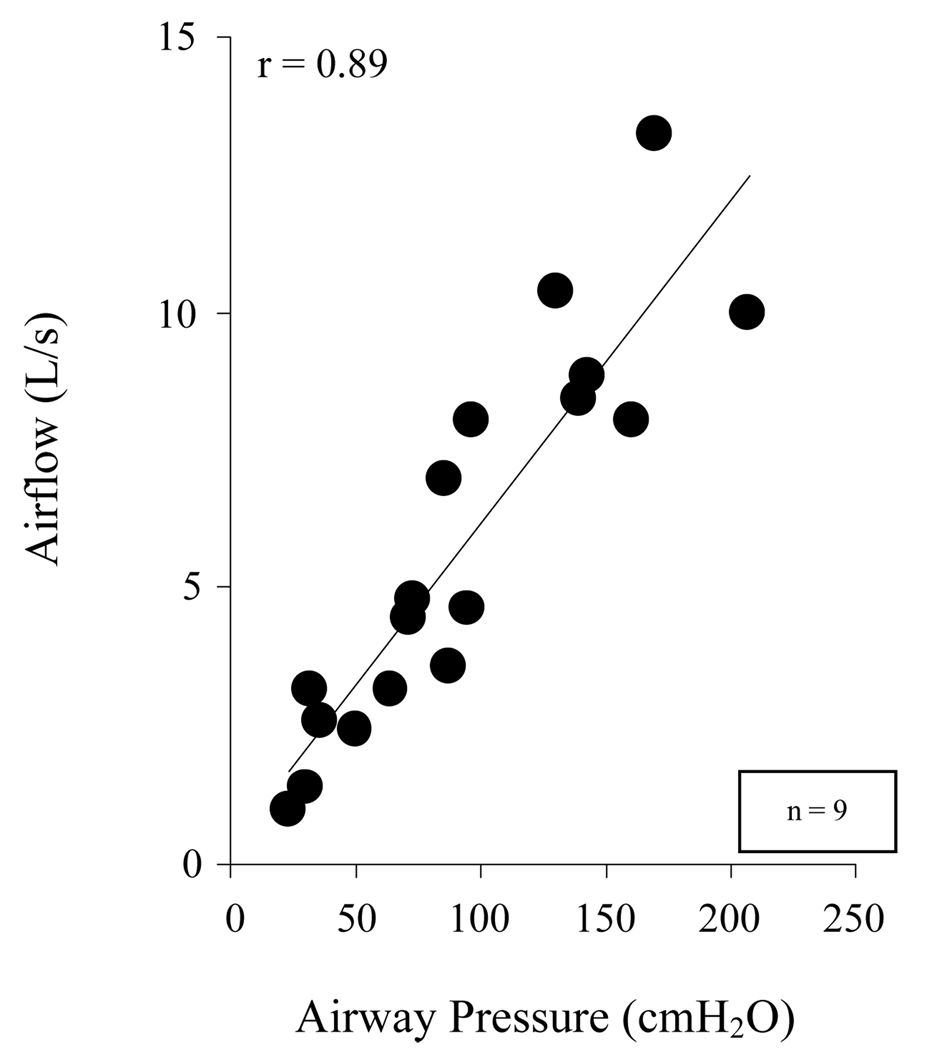
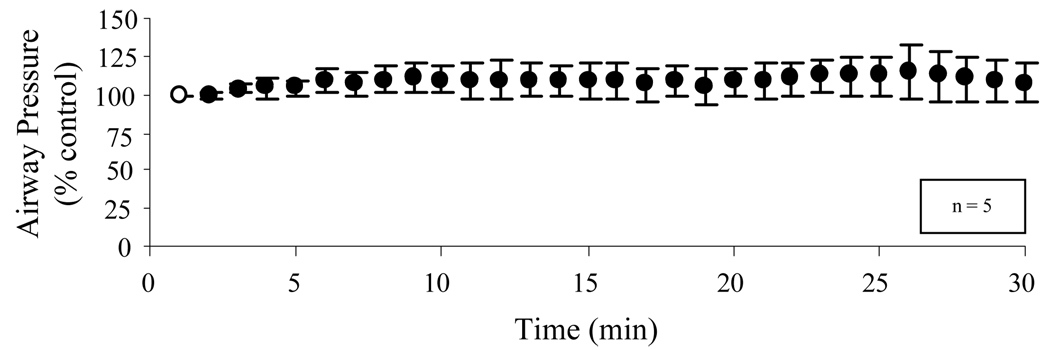
Results: Supramaximal SCS resulted in high peak airflow rates and large airway pressures during stimulation at each electrode lead. Maximum peak airflow rates and airway pressures were achieved with combined stimulation of any 2 leads. At total lung capacity, mean maximum peak airflow rates and airway pressure generation were 8.6+/-1.8 (mean +/- SE) L/s and 137+/-30 cmH2O (mean +/- SE), respectively.

Conclusions: Lower thoracic SCS results in near maximum activation of the expiratory muscles and the generation of high peak airflow rates and positive airway pressures in the range of those observed with maximum cough efforts in healthy persons.

Trial registration: ClinicalTrials.gov NCT00116337.


Figures

Figure 1
Figure 1
Electrical Stimulation System. See text for further explanation.
Figure 2
Figure 2
Effects of lower thoracic SCS for one subject on airflow and airway pressure generation during stimulation at the T9, T11 and L1 spinal levels alone and in combinations at TLC (panel A) and at FRC (panel B). Large airway pressures and airflow rates were generated during single site stimulation. These parameters were greater with combined stimulation at any 2 sites. Combined stimulation at all 3 sites did not result in further increases in these parameters. See text for further explanation.
Figure 3
Figure 3
Mean peak airflow rates (upper panel) and mean airway pressures (lower panel) during SCS at the T9, T11, and L1 spinal levels alone and in combinations at TLC (solid bars) and at FRC (dotted bars). Mean spontaneous airway pressure and peak expiratory flow rates are shown for comparison (empty bars). Large airway pressures and peak airflow rates of similar magnitude were generated during SCS during single site stimulation. Combined stimulation of 2 sites, however, resulted in significantly greater airway pressures and peak airflow rates (p < 0.05, for each). There were no significant differences in either peak airflow rates or airway pressure generation between any 2 sites. Combined stimulation of 3 sites did not result in further increases in these parameters. See text for further explanation.
Figure 4
Figure 4
Relationship between stimulus frequency (Hz) and mean airway pressure generation (expressed as a percent maximum) during single site SCS and combined stimulation of 2 sites at FRC and at TLC. There were progressive increases in airway pressure generation with increases in stimulus frequency. There was a plateau between 40 and 50 Hz, as there were only small changes in pressure generation between these stimulus frequencies. There were no significant differences between responses at TLC and FRC. See text for further explanation.
Figure 5
Figure 5
Relationship between stimulus amplitude (V) and mean airway pressure generation (expressed as a percent maximum) during single site SCS and combined stimulation of 2 sites at FRC and at TLC. There were progressive increases in airway pressure generation with increasing stimulus amplitude. With 2 site stimulation, a plateau developed between 30 and 40 V, as there were no significant differences in pressure generation between these amplitude levels (p > 0.05). There were no significant differences between responses at TLC and FRC. See text for further explanation.
Figure 6
Figure 6
Relationship between pulse width (µs) and mean airway pressure generation (expressed as a percent maximum) during combined stimulation at 2 sites at TLC. There was a significant increase in pressure generation between 100 and 150 µs (p < 0.05). However, there were no further increases in pressure generation with increasing pulse duration as high as 250 µs.
Figure 7
Figure 7
Relationship between airway pressure and peak airflow generation, for each subject at FRC and at TLC. There was a highly significant linear relationship between these parameters (p < 0.01). By this relationship, peak airflow rates could be predicted based upon the magnitude of airway pressure generation.
Figure 8
Figure 8
Mean changes in airway pressure (expressed as a percent maximum) with 2 site SCS applied every 1 min over a 30 min period. There were no significant decrements in airway pressure generation over this time period indicating no evidence of system fatigue during the chronic application of SCS.

References

    1. DeTroyer A, Estenne M, Heilporn A. Mechanism of active expiration in tetraplegic subjects. N Engl J Med. 1986;314:740–744. - PubMed
    1. Estenne M, DeTroyer A. Cough in tetraplegic subjects: an active process. Ann Intern Med. 1990;112:22–28. - PubMed
    1. Kelly BJ, Luce JM. The diagnosis and management of neuromuscular diseases causing respiratory failure. Chest. 1991;99:1485–1494. - PubMed
    1. McMichan JC, Michel L, Westbrook PR. Pulmonary dysfunction following traumatic quadriplegia: recognition, prevention and treatment. JAMA. 1980;243:528–531. - PubMed
    1. Carter RE. Respiratory aspects of spinal cord injury management. Paraplegia. 1987;25:262–266. - PubMed

Publication types

MeSH terms

Associated data