Characterization of peri-infarct zone heterogeneity by contrast-enhanced multidetector computed tomography: a comparison with magnetic resonance imaging
- PMID: 19406346
- PMCID: PMC3381611
- DOI: 10.1016/j.jacc.2009.01.056
Characterization of peri-infarct zone heterogeneity by contrast-enhanced multidetector computed tomography: a comparison with magnetic resonance imaging
Abstract
Objectives: This study examined whether multidetector computed tomography (MDCT) improves the ability to define peri-infarct zone (PIZ) heterogeneity relative to magnetic resonance imaging (MRI).
Background: The PIZ as characterized by delayed contrast-enhancement (DE)-MRI identifies patients susceptible to ventricular arrhythmias and predicts outcome after myocardial infarction (MI).
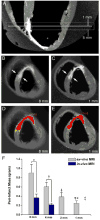
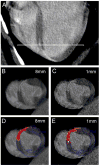
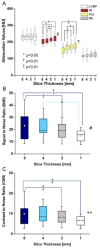
Methods: Fifteen mini-pigs underwent coronary artery occlusion followed by reperfusion. Both MDCT and MRI were performed on the same day approximately 6 months after MI induction, followed by animal euthanization and ex vivo MRI (n = 5). Signal density threshold algorithms were applied to MRI and MDCT datasets reconstructed at various slice thicknesses (1 to 8 mm) to define the PIZ and to quantify partial volume effects.
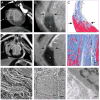
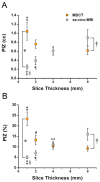
Results: The DE-MDCT reconstructed at 8-mm slice thickness showed excellent correlation of infarct size with post-mortem pathology (r2 = 0.97; p < 0.0001) and MRI (r2 = 0.92; p < 0.0001). The DE-MDCT and -MRI were able to detect a PIZ in all animals, which correlates to a mixture of viable and nonviable myocytes at the PIZ by histology. The ex vivo DE-MRI PIZ volume decreased with slice thickness from 0.9 +/- 0.2 ml at 8 mm to 0.2 +/- 0.1 ml at 1 mm (p = 0.01). The PIZ volume/mass by DE-MDCT increased with decreasing slice thickness because of declining partial volume averaging in the PIZ, but was susceptible to increased image noise.
Conclusions: A DE-MDCT provides a more detailed assessment of the PIZ in chronic MI and is less susceptible to partial volume effects than MRI. This increased resolution best reflects the extent of tissue mixture by histopathology and has the potential to further enhance the ability to define the substrate of malignant arrhythmia in ischemic heart disease noninvasively.
Figures

Similar articles
-
Cardiovascular magnetic resonance characterization of peri-infarct zone remodeling following myocardial infarction.J Cardiovasc Magn Reson. 2012 Apr 17;14(1):24. doi: 10.1186/1532-429X-14-24. J Cardiovasc Magn Reson. 2012. PMID: 22510220 Free PMC article.
-
Multi-detector CT and MRI of microembolized myocardial infarct: monitoring of left ventricular function, perfusion, and myocardial viability in a swine model.Acta Radiol. 2016 Feb;57(2):215-24. doi: 10.1177/0284185115574737. Epub 2015 Mar 2. Acta Radiol. 2016. PMID: 25735621
-
Prospective electrocardiogram-gated delayed enhanced multidetector computed tomography accurately quantifies infarct size and reduces radiation exposure.JACC Cardiovasc Imaging. 2009 Apr;2(4):412-20. doi: 10.1016/j.jcmg.2008.12.019. JACC Cardiovasc Imaging. 2009. PMID: 19580722
-
Contrast-enhanced multidetector computed tomography viability imaging after myocardial infarction: characterization of myocyte death, microvascular obstruction, and chronic scar.Circulation. 2006 Jan 24;113(3):394-404. doi: 10.1161/CIRCULATIONAHA.105.521450. Circulation. 2006. PMID: 16432071 Free PMC article.
-
Magnetic resonance imaging and multi-detector computed tomography assessment of extracellular compartment in ischemic and non-ischemic myocardial pathologies.World J Cardiol. 2014 Nov 26;6(11):1192-208. doi: 10.4330/wjc.v6.i11.1192. World J Cardiol. 2014. PMID: 25429331 Free PMC article. Review.
Cited by
-
Reperfusion injury components and manifestations determined by cardiovascular MR and MDCT imaging.World J Radiol. 2010 Jan 28;2(1):1-14. doi: 10.4329/wjr.v2.i1.1. World J Radiol. 2010. PMID: 21160735 Free PMC article.
-
Heterogeneous microinfarcts caused by coronary microemboli: evaluation with multidetector CT and MR imaging in a swine model.Radiology. 2010 Mar;254(3):718-28. doi: 10.1148/radiol.09090527. Radiology. 2010. PMID: 20177087 Free PMC article.
-
Image-guided therapies for myocardial repair: concepts and practical implementation.Eur Heart J Cardiovasc Imaging. 2013 Aug;14(8):741-51. doi: 10.1093/ehjci/jet038. Epub 2013 May 29. Eur Heart J Cardiovasc Imaging. 2013. PMID: 23720377 Free PMC article. Review.
-
Cardiovascular magnetic resonance characterization of peri-infarct zone remodeling following myocardial infarction.J Cardiovasc Magn Reson. 2012 Apr 17;14(1):24. doi: 10.1186/1532-429X-14-24. J Cardiovasc Magn Reson. 2012. PMID: 22510220 Free PMC article.
-
Late enhanced computed tomography in Hypertrophic Cardiomyopathy enables accurate left-ventricular volumetry.Eur Radiol. 2015 Feb;25(2):575-84. doi: 10.1007/s00330-014-3434-0. Epub 2014 Oct 15. Eur Radiol. 2015. PMID: 25316053
References
-
- American Heart Association. Heart and Stroke Statistics - 2008 Update. [cited 10 June 2008]. Available at.
-
- Burt RW, Perkins OW, Oppenheim BE, et al. Direct comparison of fluorine-18-FDG SPECT, fluorine-18-FDG PET and rest thallium-201 SPECT for detection of myocardial viability. J Nucl Med. 1995;36:176–9. - PubMed
-
- Mahrholdt H, Wagner A, Judd RM, Sechtem U. Assessment of myocardial viability by cardiovascular magnetic resonance imaging. Eur Heart J. 2002;23:602–19. - PubMed
-
- Sicari R, Pasanisi E, Venneri L, Landi P, Cortigiani L, Picano E. Stress echo results predict mortality: a large-scale multicenter prospective international study. J Am Coll Cardiol. 2003;41:589–95. - PubMed
-
- Iskandrian AS, Heo J, Schelbert HR. Myocardial viability: methods of assessment and clinical relevance. Am Heart J. 1996;132:1226–35. - PubMed
Publication types
MeSH terms
Substances
Grants and funding
LinkOut - more resources
Full Text Sources
Other Literature Sources
Medical

