. 2009 Jul 1;46(3):834-43.
doi: 10.1016/j.neuroimage.2009.01.070.

The spatio-temporal mapping of epileptic networks: combination of EEG-fMRI and EEG source imaging

Affiliations

The spatio-temporal mapping of epileptic networks: combination of EEG-fMRI and EEG source imaging

S Vulliemoz et al. Neuroimage. .

Abstract

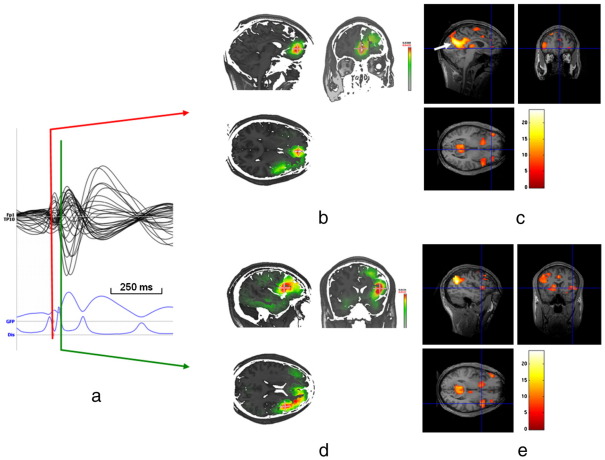
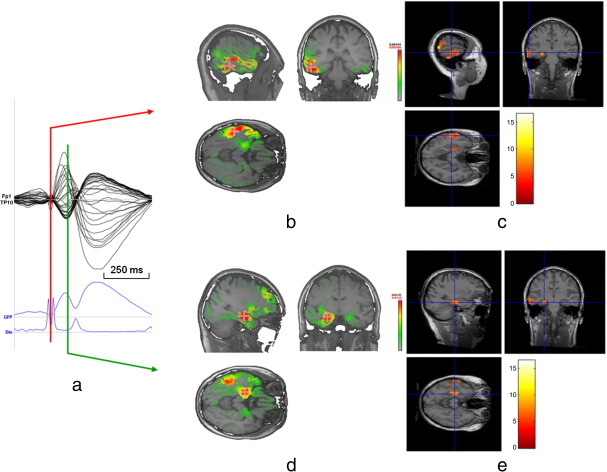
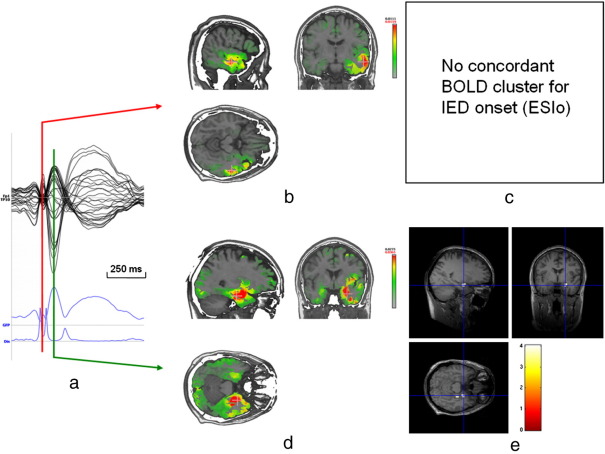
Simultaneous EEG-fMRI acquisitions in patients with epilepsy often reveal distributed patterns of Blood Oxygen Level Dependant (BOLD) change correlated with epileptiform discharges. We investigated if electrical source imaging (ESI) performed on the interictal epileptiform discharges (IED) acquired during fMRI acquisition could be used to study the dynamics of the networks identified by the BOLD effect, thereby avoiding the limitations of combining results from separate recordings. Nine selected patients (13 IED types identified) with focal epilepsy underwent EEG-fMRI. Statistical analysis was performed using SPM5 to create BOLD maps. ESI was performed on the IED recorded during fMRI acquisition using a realistic head model (SMAC) and a distributed linear inverse solution (LAURA). ESI could not be performed in one case. In 10/12 remaining studies, ESI at IED onset (ESIo) was anatomically close to one BOLD cluster. Interestingly, ESIo was closest to the positive BOLD cluster with maximal statistical significance in only 4/12 cases and closest to negative BOLD responses in 4/12 cases. Very small BOLD clusters could also have clinical relevance in some cases. ESI at later time frame (ESIp) showed propagation to remote sources co-localised with other BOLD clusters in half of cases. In concordant cases, the distance between maxima of ESI and the closest EEG-fMRI cluster was less than 33 mm, in agreement with previous studies. We conclude that simultaneous ESI and EEG-fMRI analysis may be able to distinguish areas of BOLD response related to initiation of IED from propagation areas. This combination provides new opportunities for investigating epileptic networks.


Figures

Fig. 1
Fig. 1
Patient 5: Example of mesial frontal onset with lateral propagation. ESI and EEG-fMRI SPM-F map (canonical HRF and 2 derivatives, Family Wise Error correction for multiple voxel comparisons) overlaid on co-registered T1-weighted image; a) averaged intra-MR IED. The first rising phase of the averaged IED and Global Field Power (GFP) is used for IED onset (ESIo, red line) and a later timeframe for IED propagation (ESIp, + 88 ms, second rising phase of the averaged IED, green line). Dis = Dissimilarity is a measure inversely related to the spatial correlation between two scalp voltage map topographies (not shown): a minimum of Dis therefore reflects a period of map stability (Lantz et al., 2003; Michel et al., 2004); b) EEG source imaging at IED onset (ESIo) in orbito-frontal cortex (bilateral but maximum in left hemisphere); c) right orbito-frontal BOLD cluster concordant to ESIo (positive BOLD response, cross-line at maximum). The highly significant BOLD response in the mesial parietal cortex corresponds to negative BOLD response in the “default mode” network (white arrow); d) EEG source imaging just after second maximum of the averaged IED showing a shift of maximal source activity to frontal-opercular region (ESIp); e) right lateral frontal BOLD cluster closest to ESIp (positive BOLD response, cross-line at maximum).
Fig. 2
Fig. 2
Patient 2: Example of ESIo concordant with negative BOLD response. ESI and EEG-fMRI SPM-F map (canonical HRF and 2 derivatives, FWE corrected) overlaid on co-registered T1-weighted image; a) averaged intra-MR IED. The first rising phase of the averaged IED and Global Field Power (GFP) is used for IED onset (ESIo, red line) and a later timeframe for IED propagation (ESIp, + 96 ms, second maximum of the averaged IED, green line). Dis = Dissimilarity (Lantz et al., 2003; Michel et al., 2004); b) EEG source imaging at IED onset (ESIo) in left lateral temporal cortex; c) left lateral temporal BOLD cluster concordant to ESIo (negative BOLD response, cross-line at maximum); d) EEG source imaging of the second maximum phase of the averaged IED showing a shift of maximal source activity to left mesial temporal lobe (ESIp); e) left mesial temporal BOLD cluster concordant with ESIp (positive BOLD response, cross-line at maximum).
Fig. 3
Fig. 3
Patient 1: Example of discordant ESIo and EEG-fMRI results. ESI and EEG-fMRI SPM-F map (canonical HRF and 2 derivatives, FWE corrected) overlaid on co-registered T1-weighted image; a) averaged intra-MR IED of the most frequent IED (right temporal). The first rising phase of the averaged IED and Global Field Power (GFP) is used for IED onset (ESIo, red line) and a later timeframe for IED propagation (ESIp, +80 ms, second maximum of the averaged IED, green line). Dis = Dissimilarity, (Lantz et al., 2003; Michel et al., 2004); b) EEG source imaging at IED onset (ESIo) in right lateral temporal cortex; c) there is no concordant mesial temporal BOLD response, even for aggregated IEDs (right temporal, right posterior temporal, right temporo-occipital); d) EEG source imaging of the next maximum of the averaged IED showing a shift of maximal source activity to right mesial temporal lobe (ESIp); e) right mesial temporal BOLD cluster concordant with ESIp (positive BOLD response for aggregated IEDs, cross-line at maximum).

References

    1. Aghakhani Y., Bagshaw A.P. fMRI activation during spike and wave discharges in idiopathic generalized epilepsy. Brain. 2004;127(Pt 5):1127–1144. - PubMed
    1. Al-Asmi A., Benar C.G. fMRI activation in continuous and spike-triggered EEG–fMRI studies of epileptic spikes. Epilepsia. 2003;44(10):1328–1339. - PubMed
    1. Allen P.J., Polizzi G. Identification of EEG events in the MR scanner: the problem of pulse artifact and a method for its subtraction. NeuroImage. 1998;8(3):229–239. - PubMed
    1. Allen P.J., Josephs O. A method for removing imaging artifact from continuous EEG recorded during functional MRI. NeuroImage. 2000;12(2):230–239. - PubMed
    1. Ashburner J., Friston K. Multimodal image coregistration and partitioning—a unified framework. NeuroImage. 1997;6(3):209–217. - PubMed

Publication types