. 2009 Jun 1;81(11):4566-75.
doi: 10.1021/ac9004452.

Magnetic bead processor for rapid evaluation and optimization of parameters for phosphopeptide enrichment

Affiliations

Magnetic bead processor for rapid evaluation and optimization of parameters for phosphopeptide enrichment

Scott B Ficarro et al. Anal Chem. .

Abstract

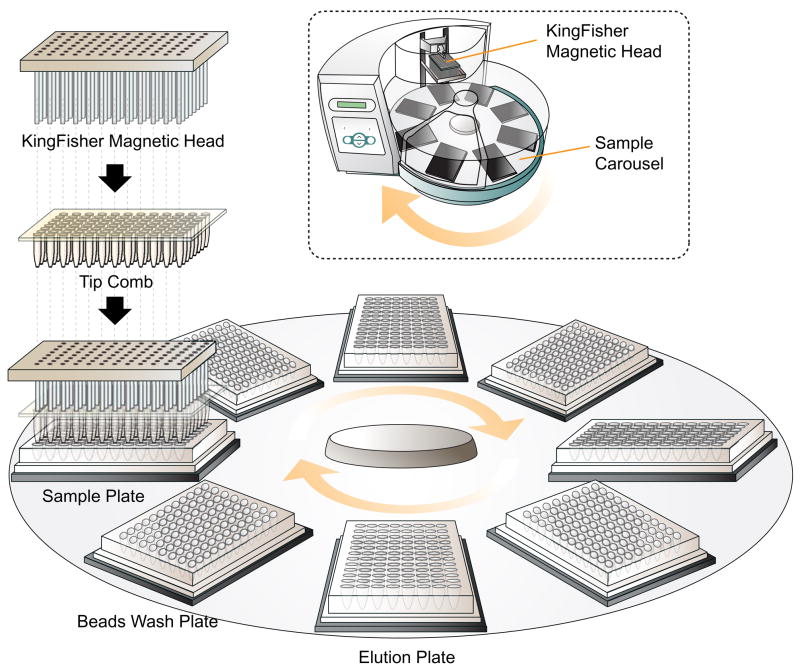
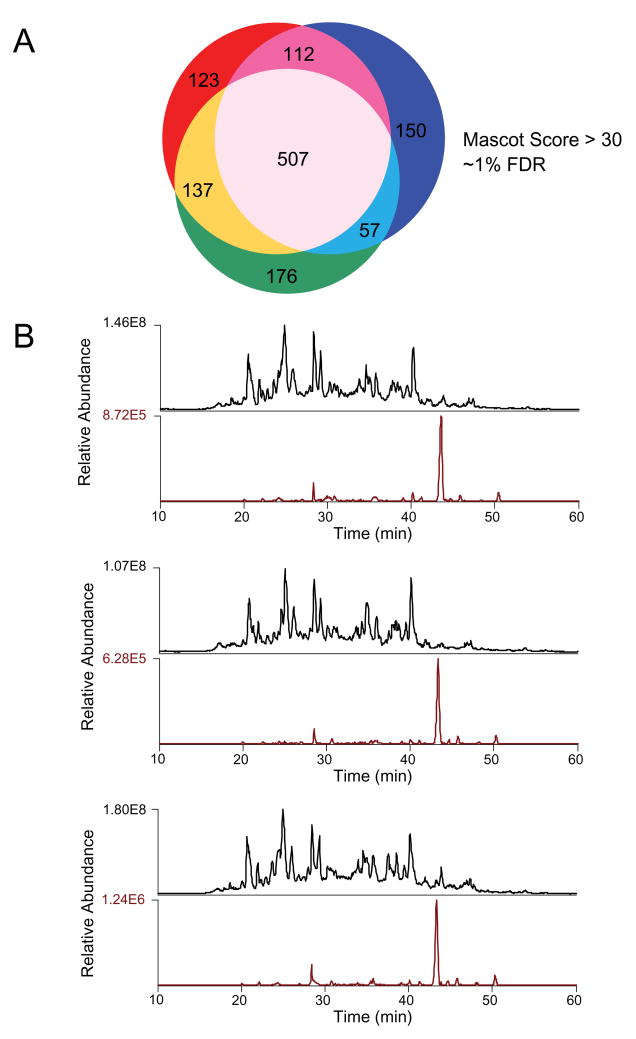
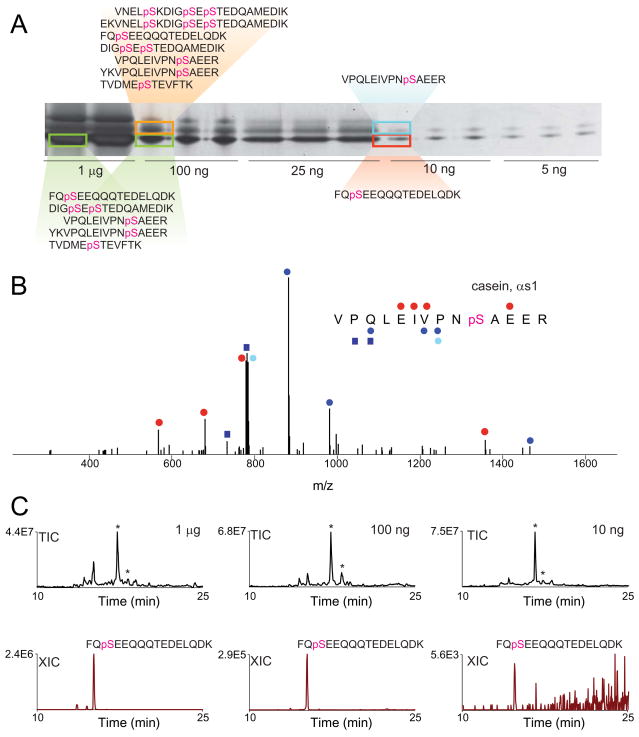
Qualitative and quantitative analysis of phosphorylation continues to be both an important and a challenging experimental paradigm in proteomics-based research. Unfortunately researchers face difficulties inherent to the optimization of complex, multivariable methods and their application to the analysis of rare and often experimentally intractable phosphorylated peptides. Here we describe a platform based on manipulation of magnetic beads in a 96-well format that facilitates rapid evaluation of experimental parameters required for enrichment of phosphopeptides. Optimized methods provided for automated enrichment and subsequent LC-MS/MS detection of over 1000 unique phosphopeptides (approximately 1% FDR) from 50 microg of cell lysates. In addition we demonstrate use of this platform for identification of phosphopeptides derived from proteins separated by SDS-PAGE and visualized near the detection limit of silver staining.


Figures

Figure 1
Figure 1
(A) Schematic illustration of the KingFisher magnetic bead processor. (B) An array of 96 magnetic pins is used on conjunction with disposable tips to transfer beads between 96-well plates on a rotary platform. The tip comb serves to mix samples when the pins are disengaged.
Figure 2
Figure 2
(A) Phosphopeptide selectivity and (B) identification (MASCOT score >30) as a function of sample reconstitution and wash buffers for Fe3+ and Ga3+-NTA based enrichment. Numbers above and below data points (B) indicate totals for all phosphopeptides (top) and multiply phosphorylated peptides (bottom) identified, respectively.
Figure 3
Figure 3
(A) Number of unique phosphopeptides identified (MASCOT score >30; ~1% FDR) as a function of acetonitrile concentration utilized for elution during reversed phase sample clean-up. (B) Venn diagram illustrates overlap in phosphopeptide identifications for the 25% and 40% organic elutions.
Figure 4
Figure 4
MALDI mass spectra of tryptic α-casein peptides before (A) and after (B) enrichment by Fe3+-NTA using the KingFisher platform. (C) MS/MS spectrum of the phosphopeptide VPQLEIVPNpSAEER observed at m/z 1660.8. *, peak corresponding to VPQLEIVPNpSAEER. Δ, peak corresponding to phosphate loss.
Figure 5
Figure 5
(A) MALDI-MS signal intensities for VPQLEIVPNpSAEER observed in 96 separate Fe3+-NTA enrichments of alpha casein digest. (B) MALDI-MS signal intensities (average of 5 experiments) for VPQLEIVPNpSAEER observed after recrystallization of target plate rows C and H. Mean intensities are depicted as a red line, while green lines denote a two-fold deviation from the mean.
Figure 6
Figure 6
(A) Venn diagram shows overlap in peptide identifications for triplicate analyses of phosphopeptides derived from 50 μg of K562 cell lysate. (B) Total ion chromatograms (TIC) and extracted ion chromatograms (XIC) for the phosphopeptide ATNEpSEDEIPQLVPIGK detected in 3 independent enrichments performed on the KingFisher.
Figure 7
Figure 7
Venn diagrams illustrating overlap in peptide identifications between (A) replicate analyses of the same enrichment and an independent enrichment analyzed the same day, (B) replicate analyses of enriched phosphopeptide samples that were frozen and one that was not. Percentages refer to overlap between indicated analyses.
Figure 8
Figure 8
(A) Varying quantities of alpha and beta casein separated by SDS-PAGE and visualized by silver stain. Bands corresponding to data displayed in (B) and (C) are indicated with boxes, along with detected phosphopeptides. (B) MS/MS spectrum of VPQLEIVPNpSAEER derived from in-gel digestion and automated phosphopeptide enrichment of the 10 ng band of alpha casein shown in (A). Blue and red circles denote singly-charged y- and b-type ions, respectively, with doubly-charged fragments indicated with squares. Neutral loss of phosphate from y7 with a lighter shade. (C) Total ion chromatograms (TIC) and extracted ion chromatograms (XIC) for the peptide FQpSEEQQQTEDELQDK detected in analyses of 1 μg, 100 ng, and 10 ng of beta casein. *, identifies elution times of carrier peptides [glu-1] fibrinopeptide B and angiotensin I.

References

    1. Posewitz MC, Tempst P. Anal Chem. 1999;71:2883–2892. - PubMed
    1. Kinoshita-Kikuta E, Kinoshita E, Yamada A, Endo M, Koike T. Proteomics. 2006;6:5088–5095. - PubMed
    1. Ficarro SB, Parikh JR, Blank NC, Marto JA. Analytical Chemistry. 2008;80:4606–4613. - PubMed
    1. Ficarro SB, McCleland ML, Stukenberg PT, Burke DJ, Ross MM, Shabanowitz J, Hunt DF, White FM. Nat Biotech. 2002;20:301–305. - PubMed
    1. Kweon HK, Hakansson K. Anal Chem. 2006;78:1743–1749. - PubMed

Publication types

MeSH terms